01
The dashboard
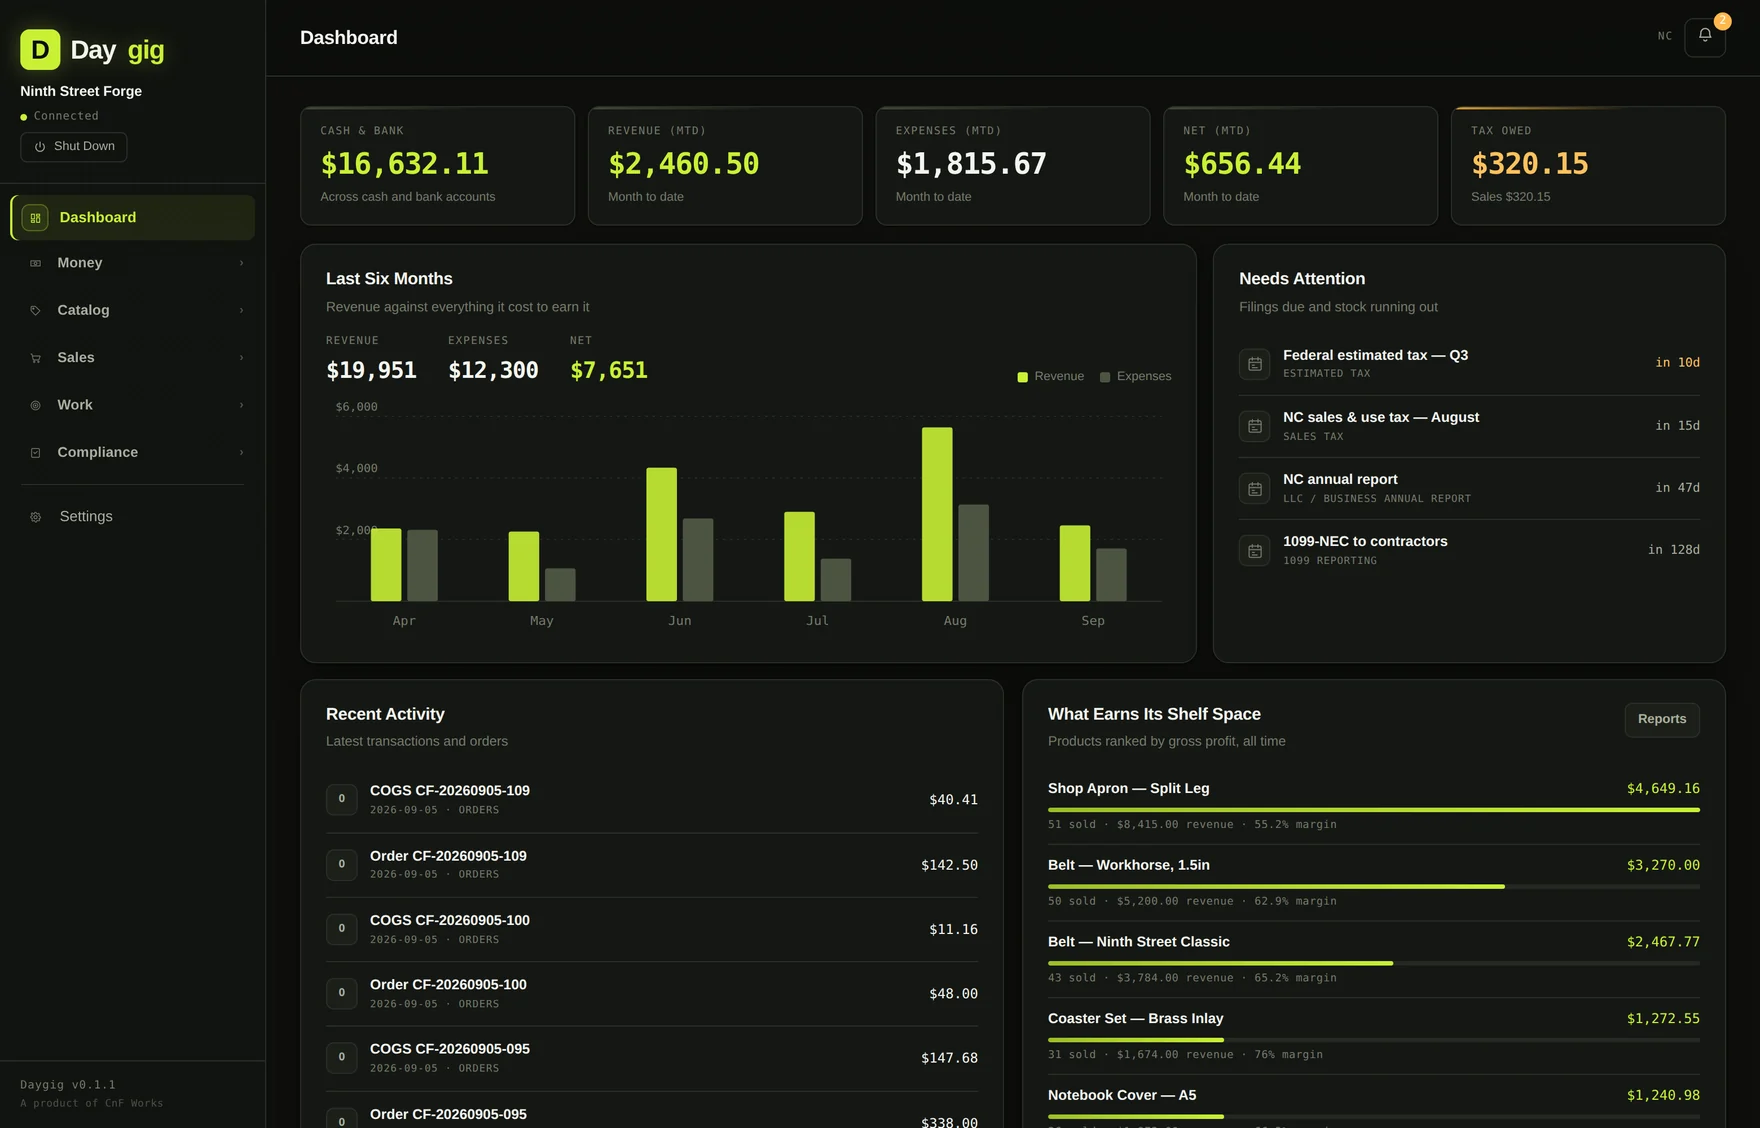
Open Daygig and the first screen answers the question you actually opened it to ask. Cash across every account. Revenue, expenses and net for the month. Sales tax accrued but not yet remitted, so the number you owe the state is never a surprise in April.
Below that: six months of revenue against everything it cost to earn. Not a vanity revenue line, but revenue plotted against cost of goods and operating expenses together. Then what needs your attention, meaning filings coming due and stock at its reorder point. Then which products actually earn their shelf space, ranked by gross profit rather than by how many you moved.
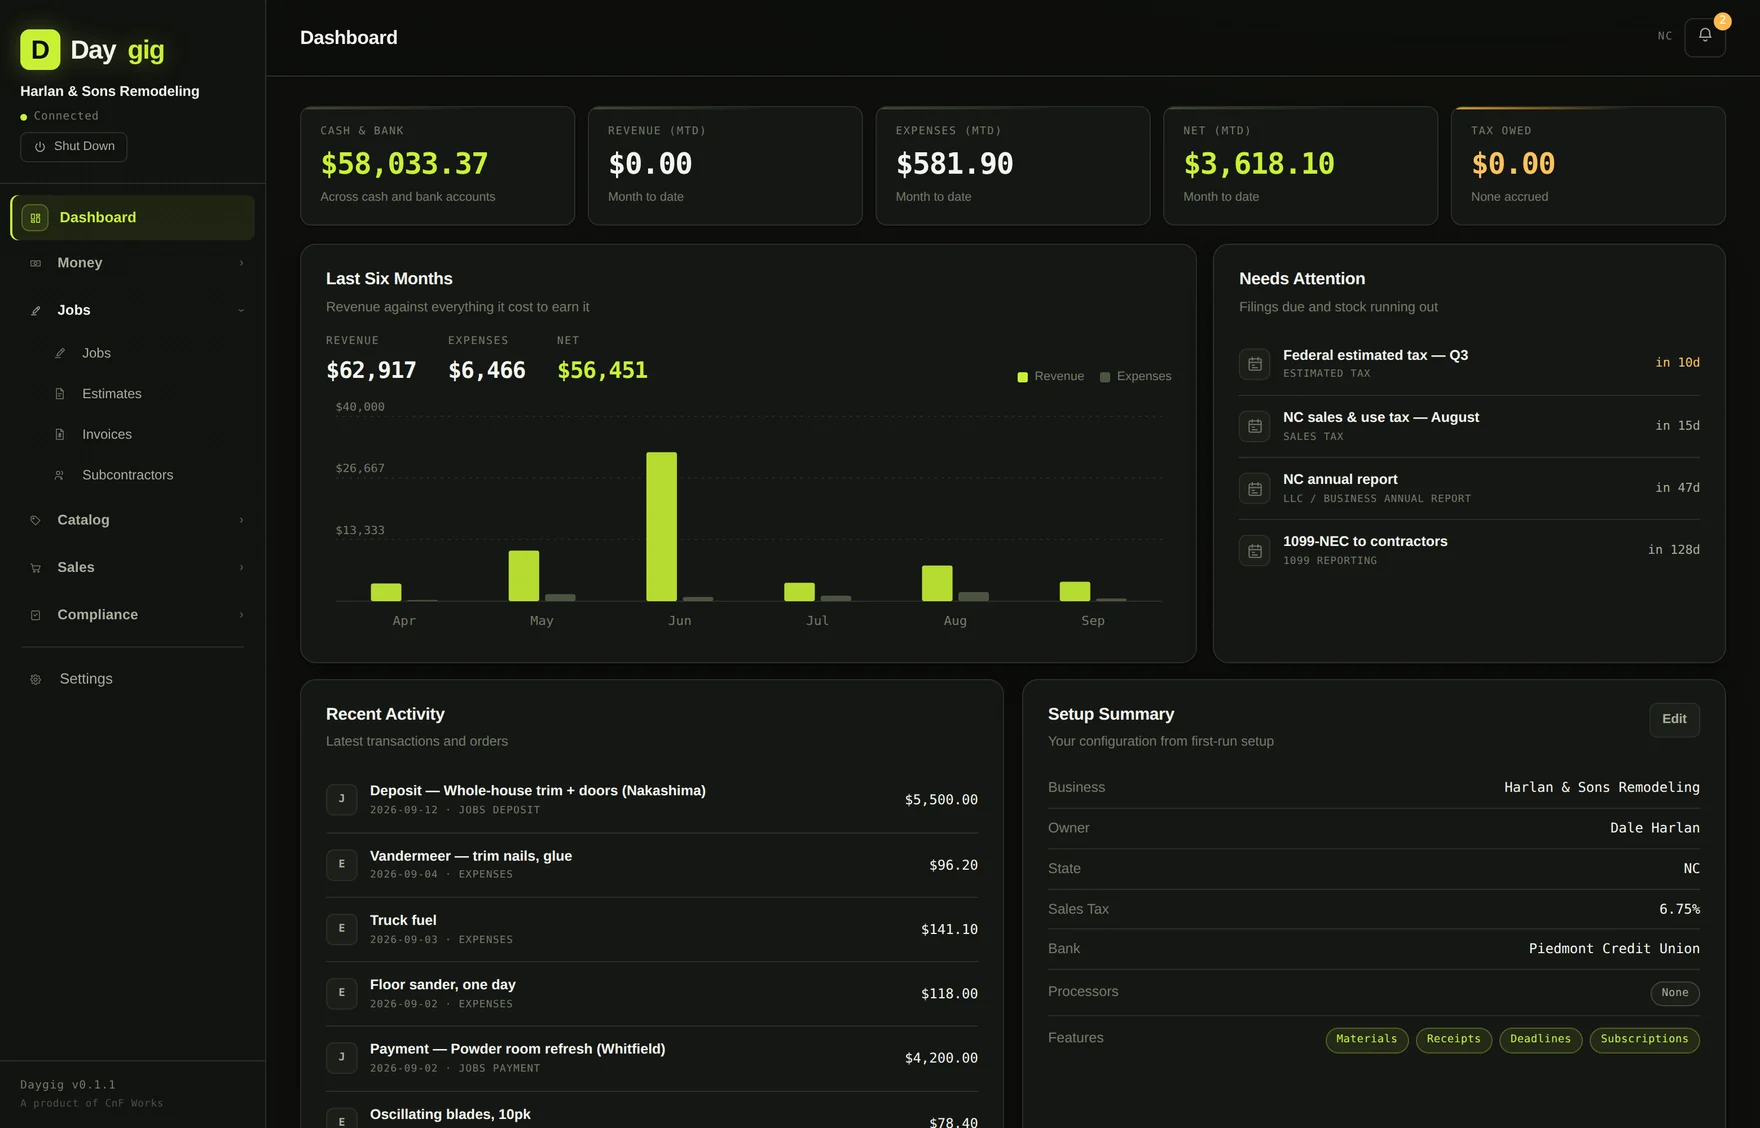
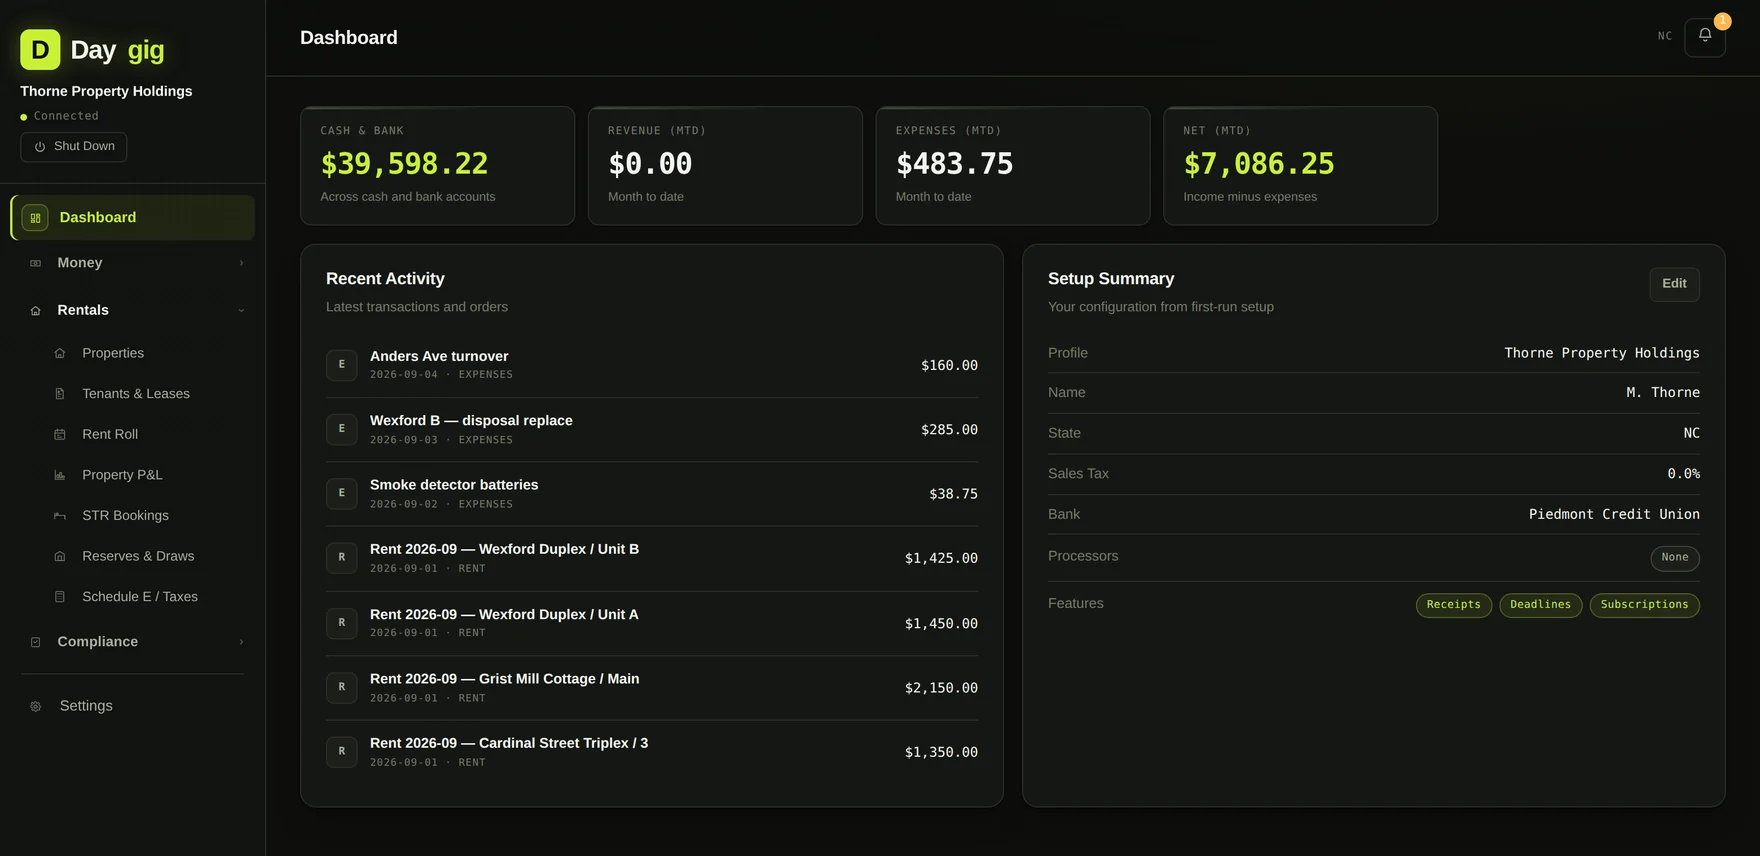
The dashboard changes shape with your mode. A contractor sees open jobs and outstanding invoices where a maker sees products. A landlord sees rent collected and what's still owed.
02
Books and ledger
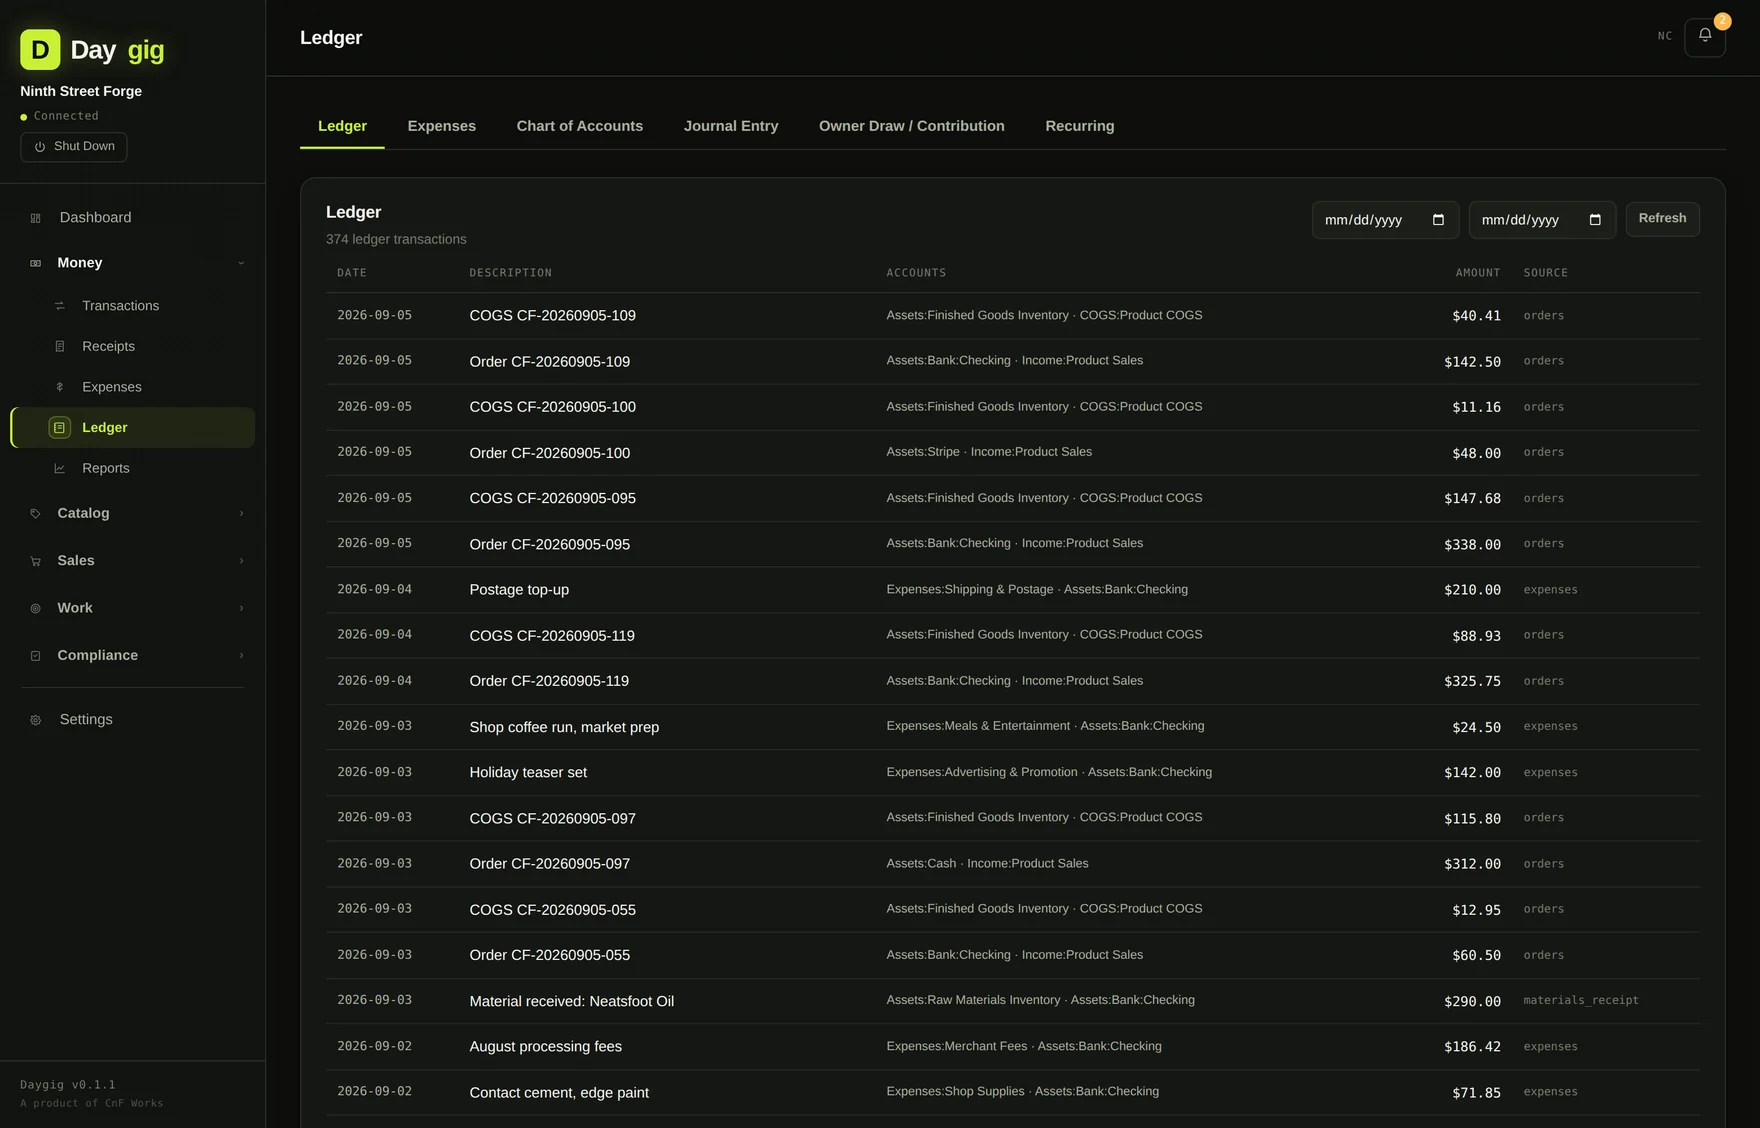
Underneath every screen in Daygig is a real double-entry ledger. Every event writes a transaction whose postings must sum to zero before it is allowed to commit, which is why the balance sheet balances instead of nearly balancing.
Sell something and four things post at once: revenue, the sales tax you owe, the inventory coming out of finished goods, and the cost of goods sold. You never type a COGS figure, and it can never drift away from what you actually shipped.
Expenses that know what they are
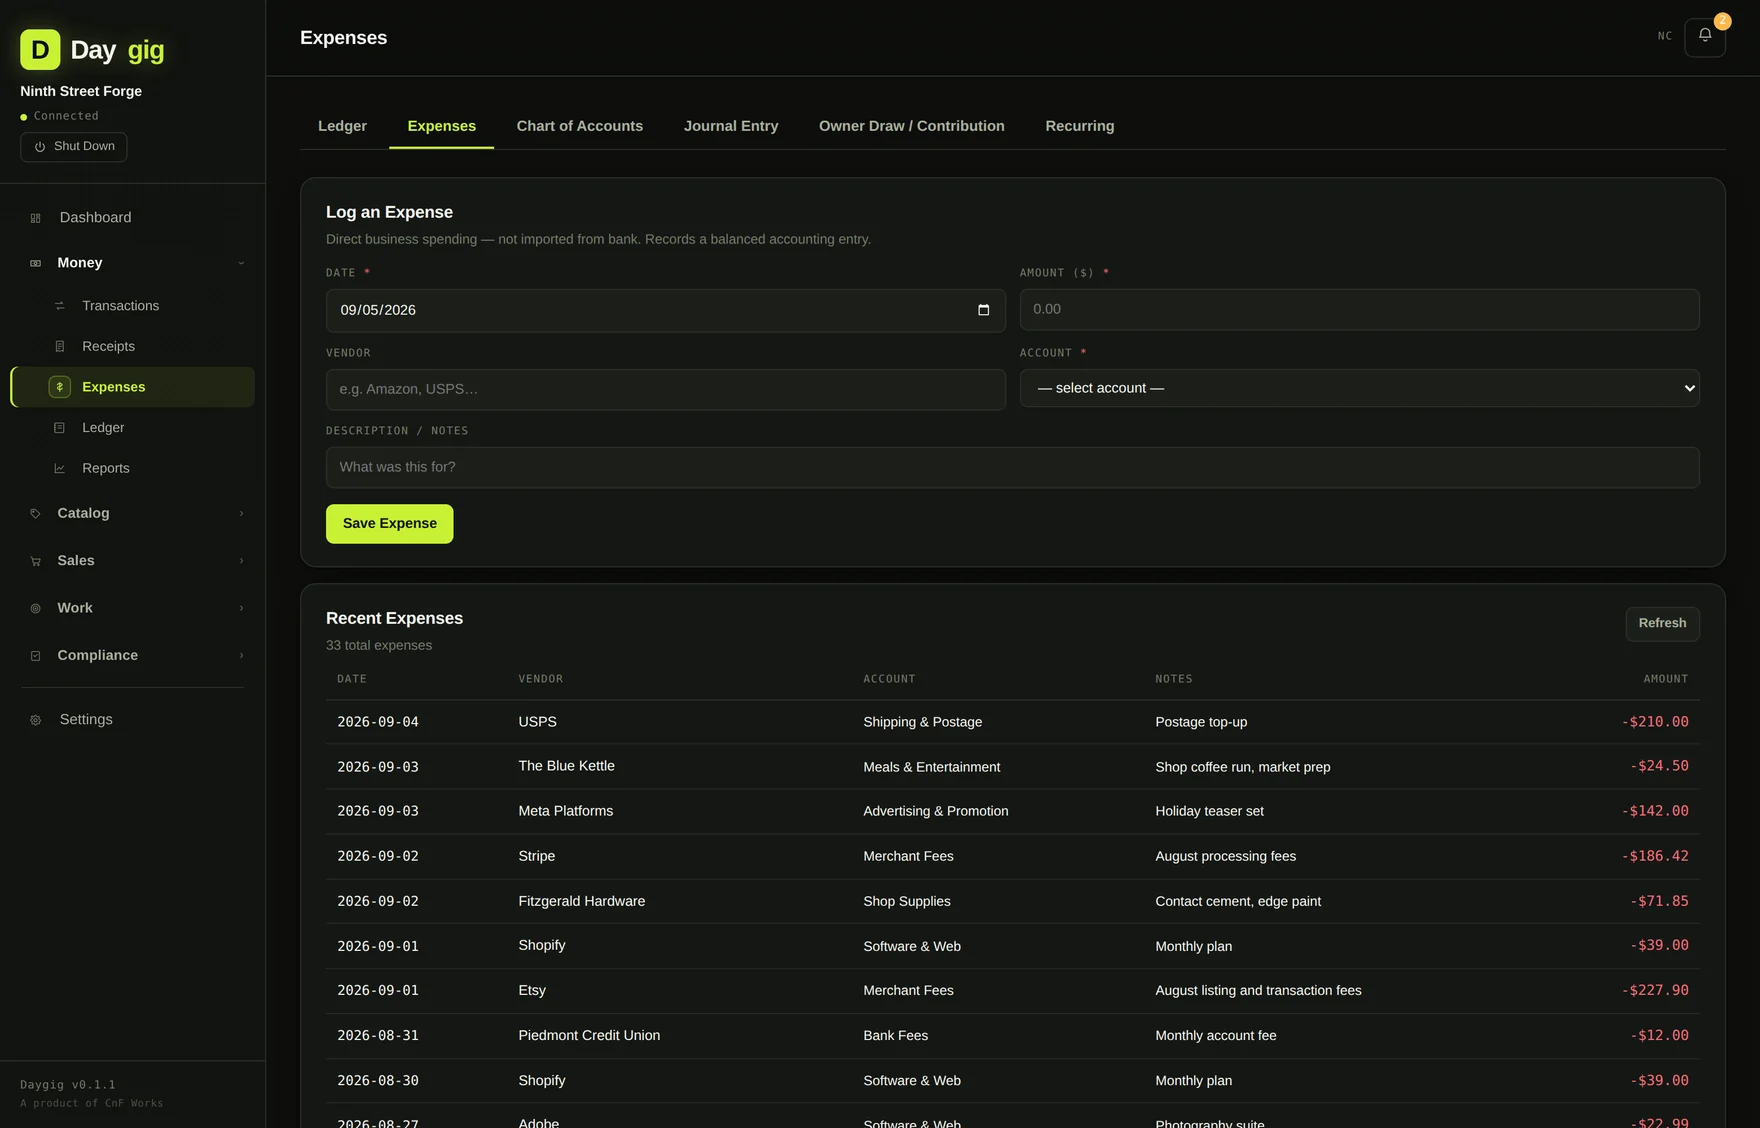
Expenses post against a chart of accounts seeded for your kind of work: booth fees and prototype costs for a maker, permits and workers comp for a contractor, mortgage interest and turnover cleaning for a landlord. Recurring charges are tracked separately so a subscription you forgot about shows up as a pattern rather than as twelve unrelated line items.
03
Reports
Open a report and it runs. There is no date picker to fill in and no button to press first. The range is already set to your year to date, and changing it re-runs on demand.
Profit and loss
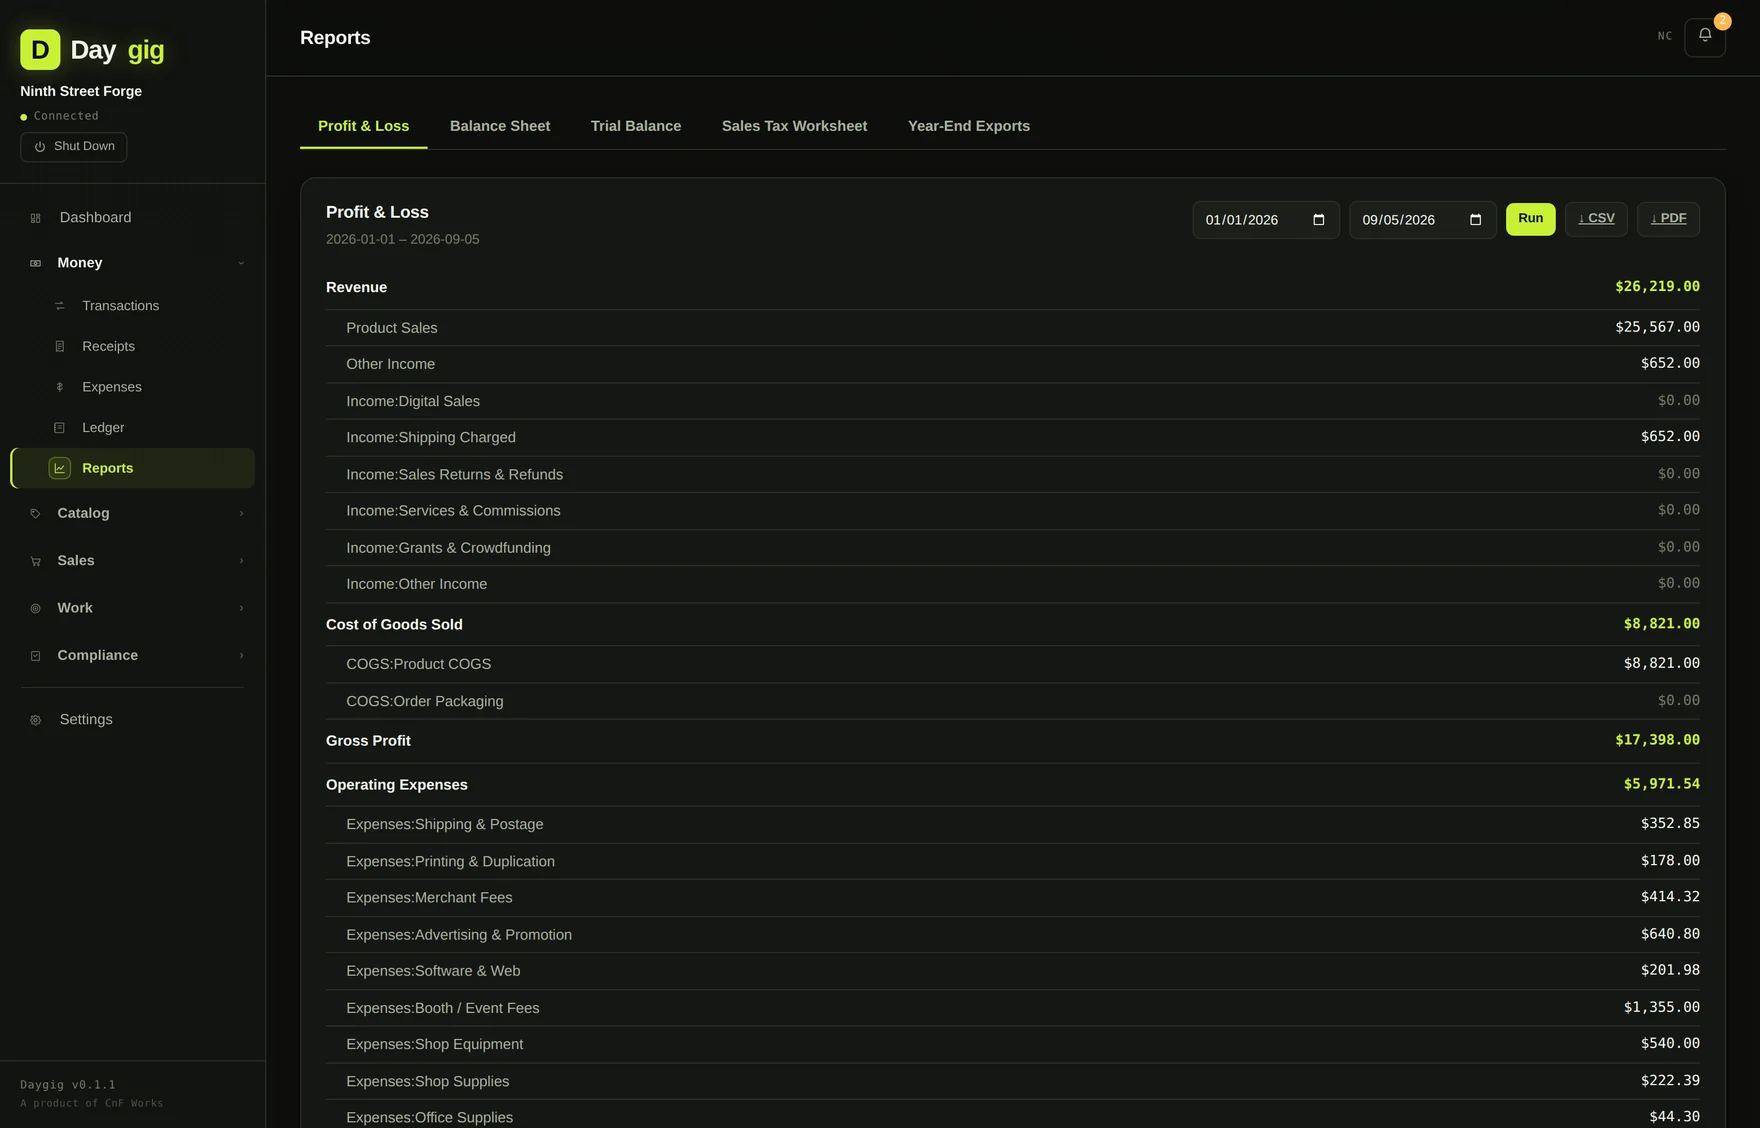
Revenue, cost of goods sold, gross profit, operating expenses by account, and net. Subtotals carry the accent so your eye lands on the figures that matter. Exports to CSV or PDF.
Balance sheet and trial balance
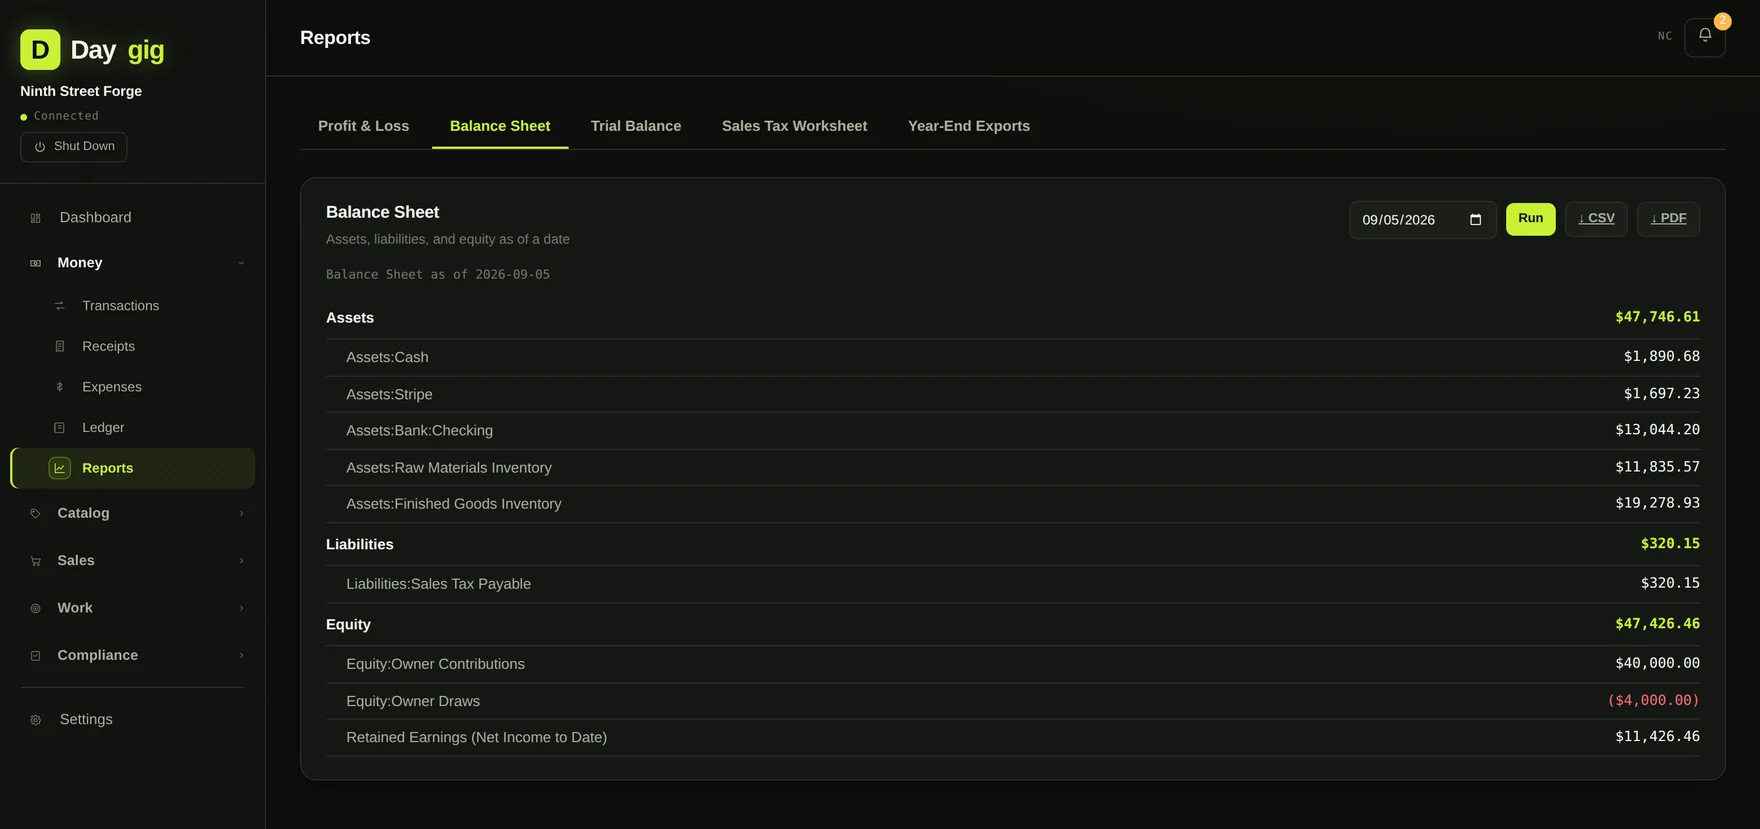
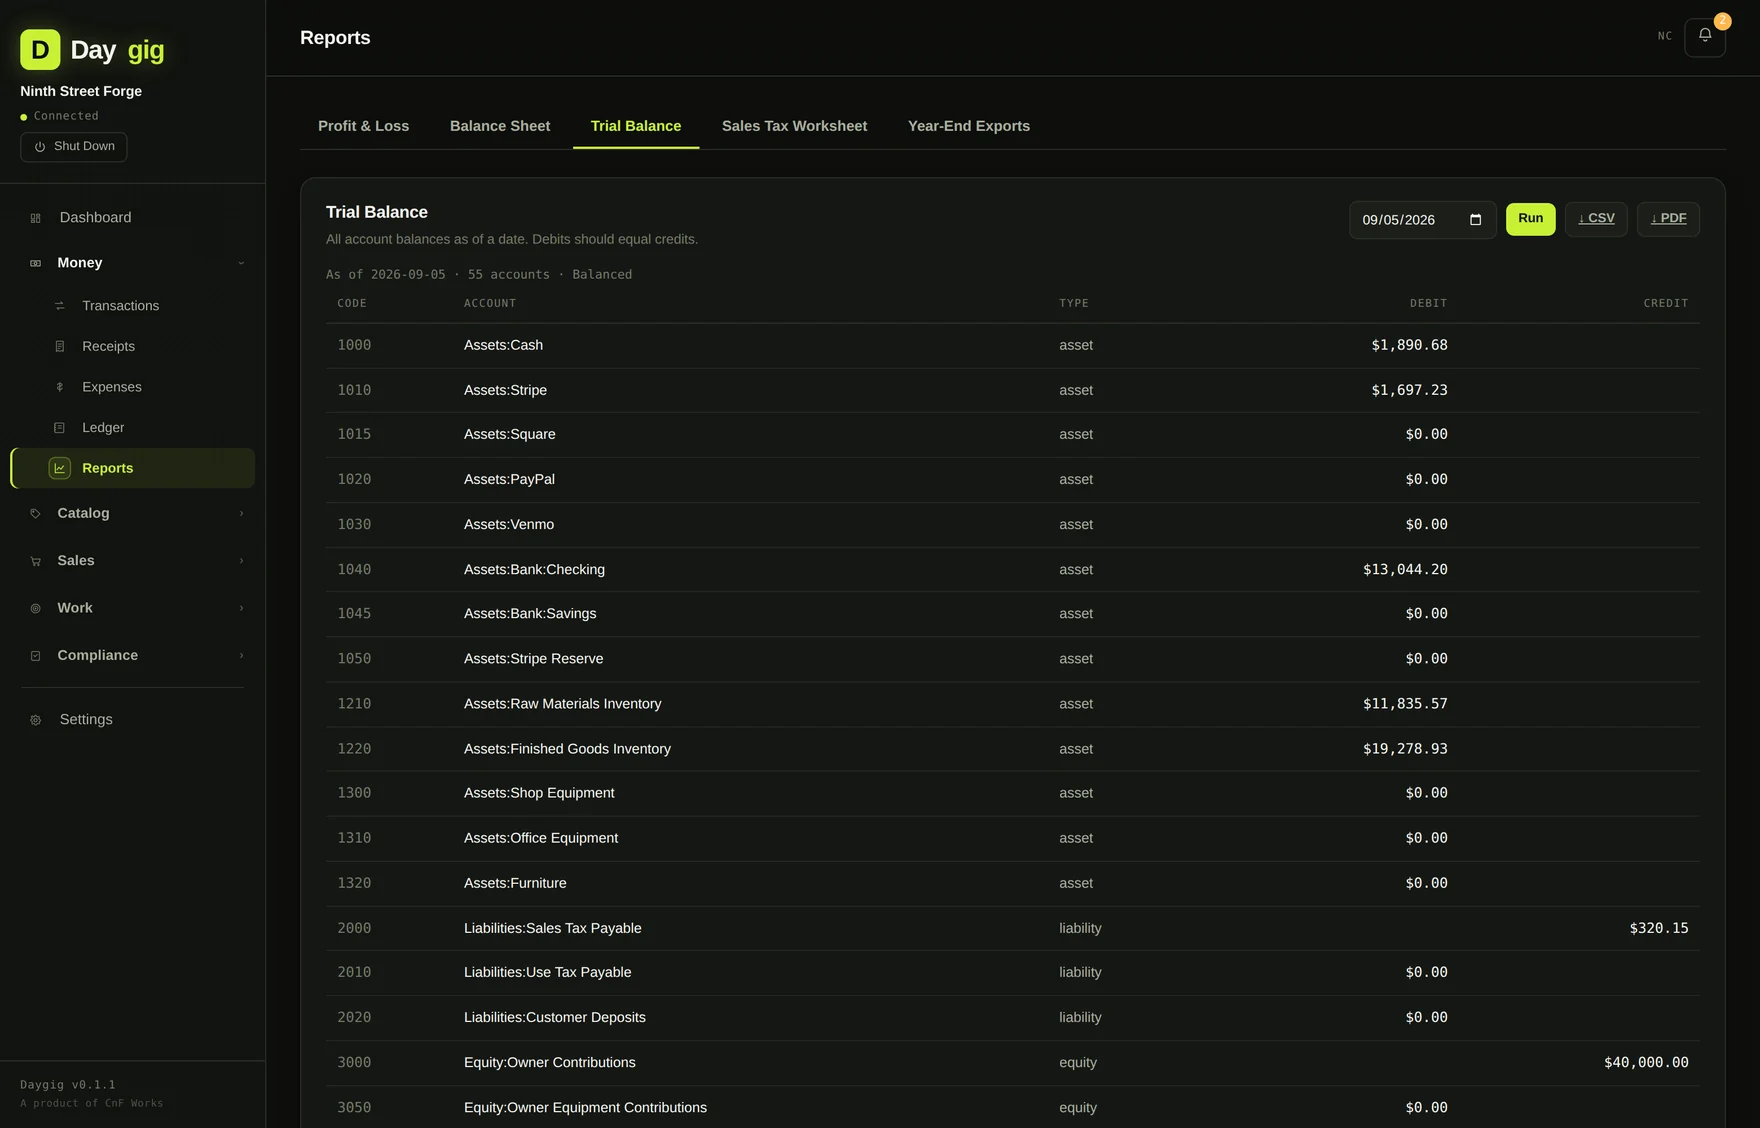
Assets, liabilities and equity as of any date, plus a trial balance that tells you whether debits equal credits — and says so explicitly rather than making you add up the columns.
Sales tax worksheet
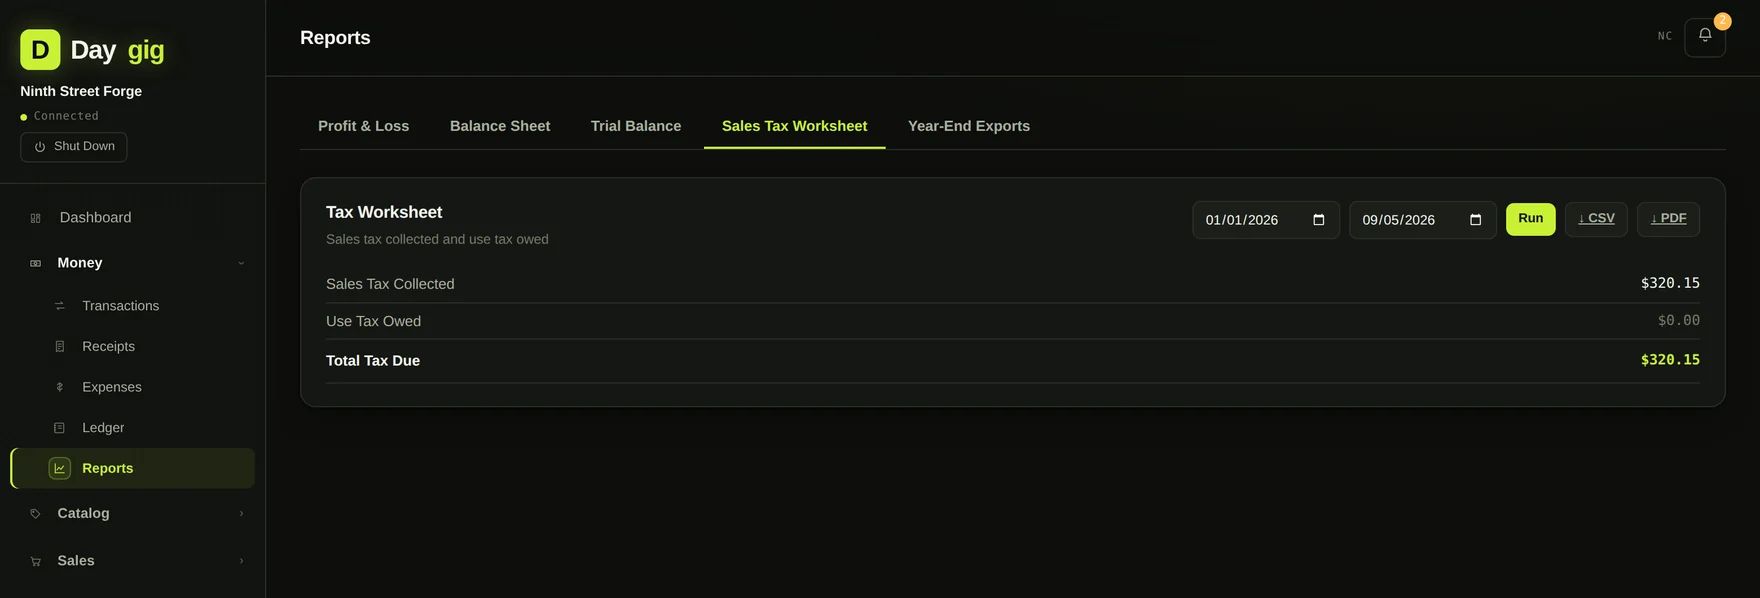
Taxable sales, tax collected, and what you still owe. Orders sold through a marketplace that collects and remits on your behalf are excluded, because that tax was never yours. It is a distinction that quietly inflates the number in most tools.
Year-end exports
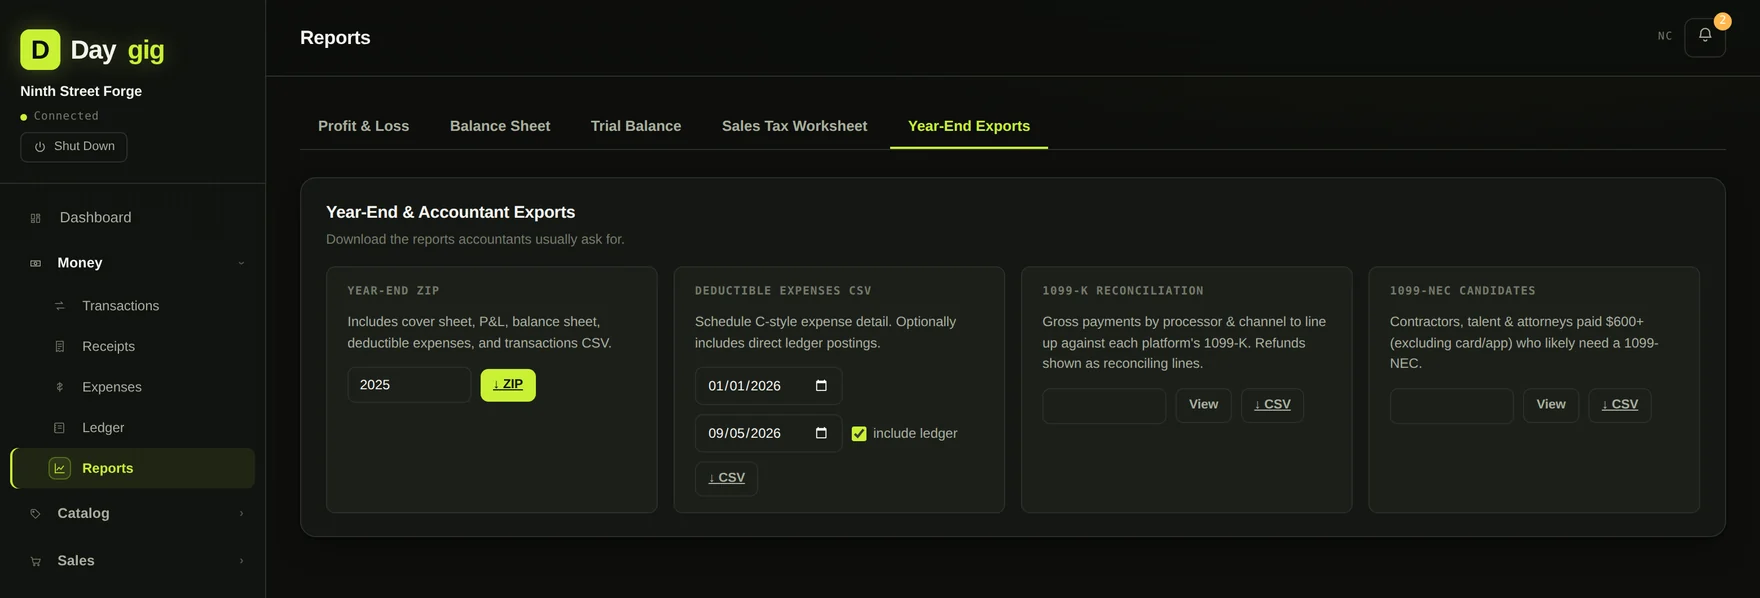
One ZIP with the whole set: P&L, balance sheet, general ledger, expense detail, mileage log, sales tax summary, inventory valuation, 1099 vendor list, and your receipt archive. Built to be emailed to an accountant without a follow-up conversation.
04
Bank and platform import
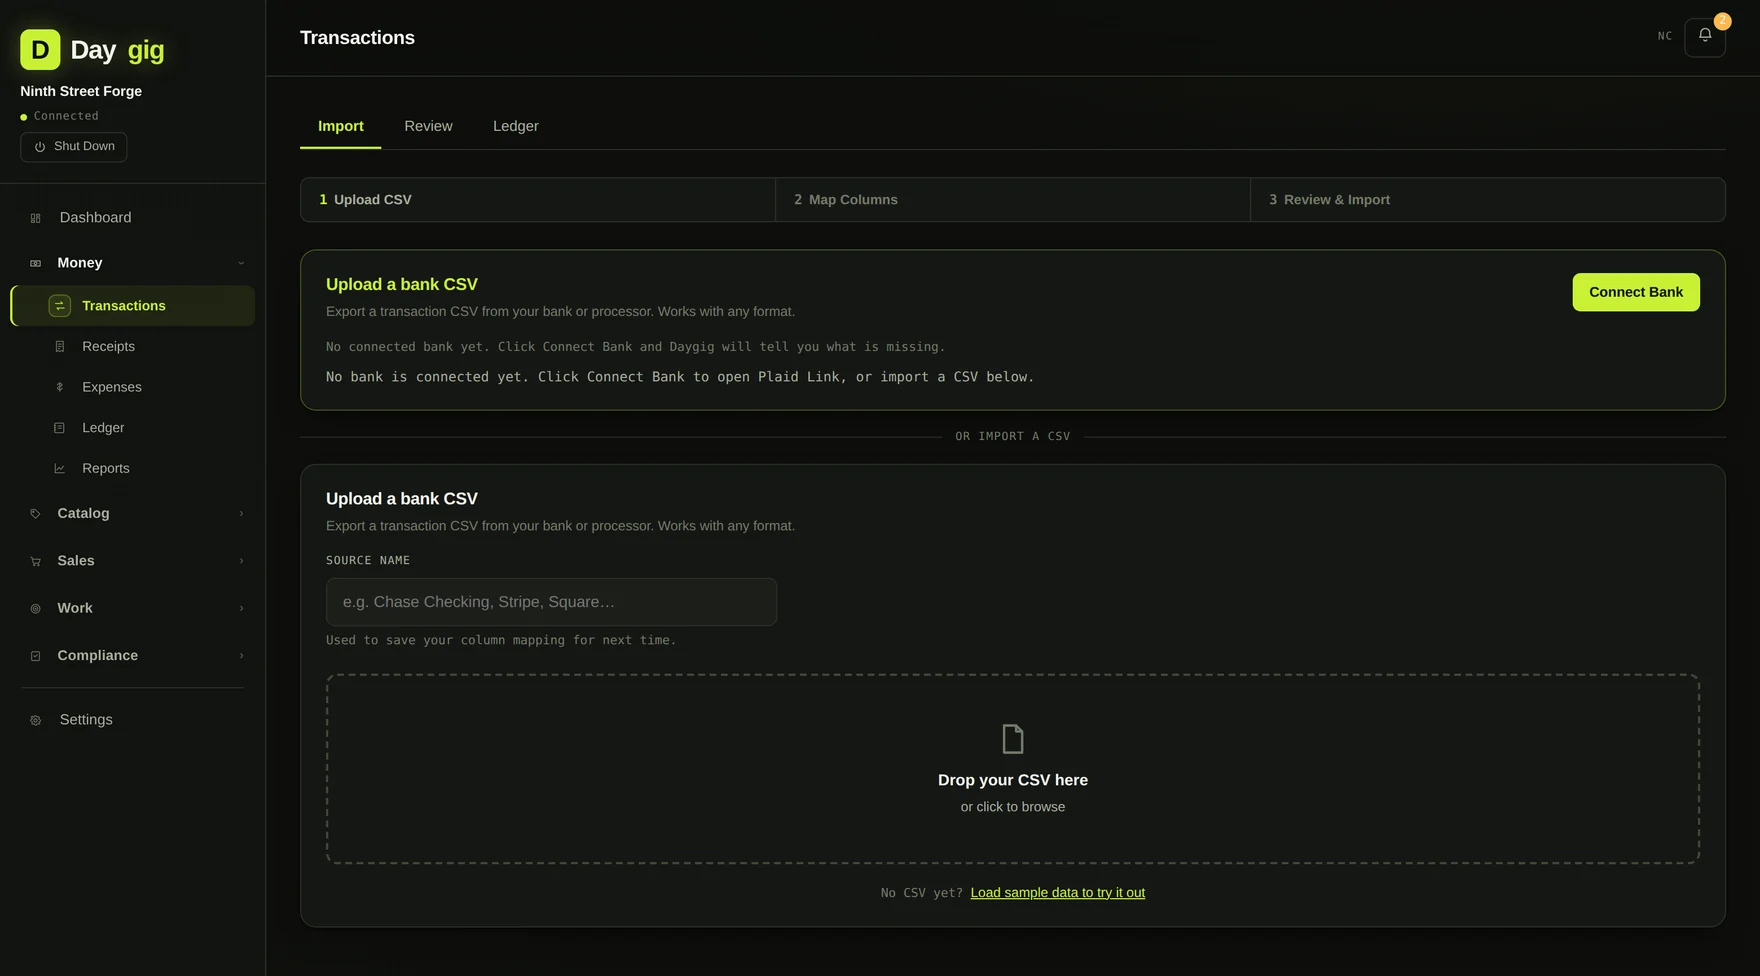
Export a CSV from your bank and drop it in. Daygig previews the file, maps the columns, and remembers the mapping so the next statement from the same bank imports without a second thought.
It also recognizes the export formats from Etsy, Shopify, Stripe, Square and PayPal and maps those columns automatically. Imported rows land in a review queue rather than going straight to your books: you categorize, Daygig suggests based on what you've done before, and posting turns each row into a balanced ledger entry. Duplicates are detected, and transfers between your own accounts are flagged so a move from checking to savings doesn't get counted as income.
05
Receipts
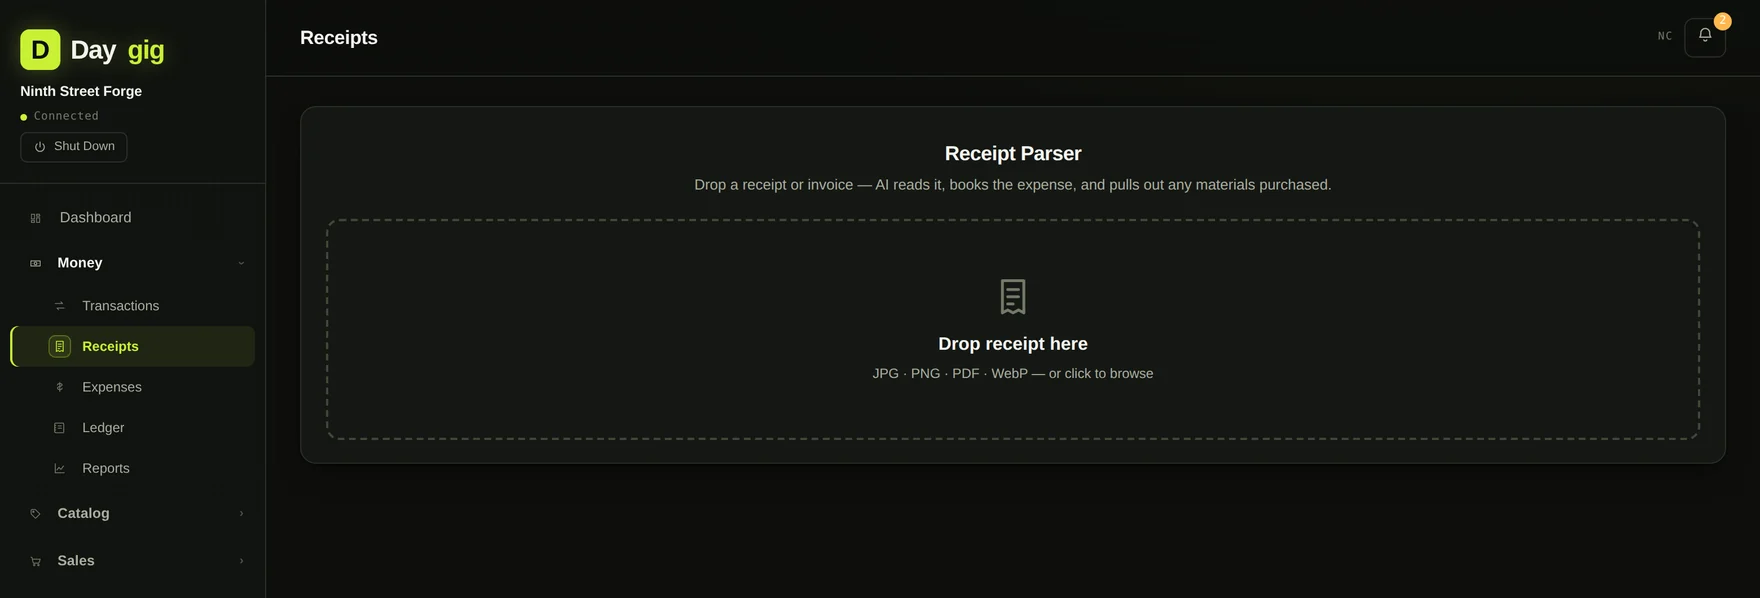
Photograph a receipt and Daygig reads the vendor, date, line items and total, then pre-fills the expense for you to confirm. Parsing uses your own Anthropic API key and goes directly from your Mac to Anthropic — it does not pass through any server of ours. It costs roughly two cents a receipt, and it is entirely optional; you can type receipts in by hand and never enter a key.
For a maker, a parsed supply receipt can post its line items straight into your materials subledger rather than landing as one lump expense, which is the difference between knowing you spent $214 at the hardware store and knowing what it bought.
Receipt images are stored alongside your database and included in the year-end export, so the substantiation travels with the numbers.
06
Products, materials, and the recipe between them
This is the part generic accounting software has no concept of. Daygig tracks what you buy, what you build, and the bill of materials connecting the two.
Materials
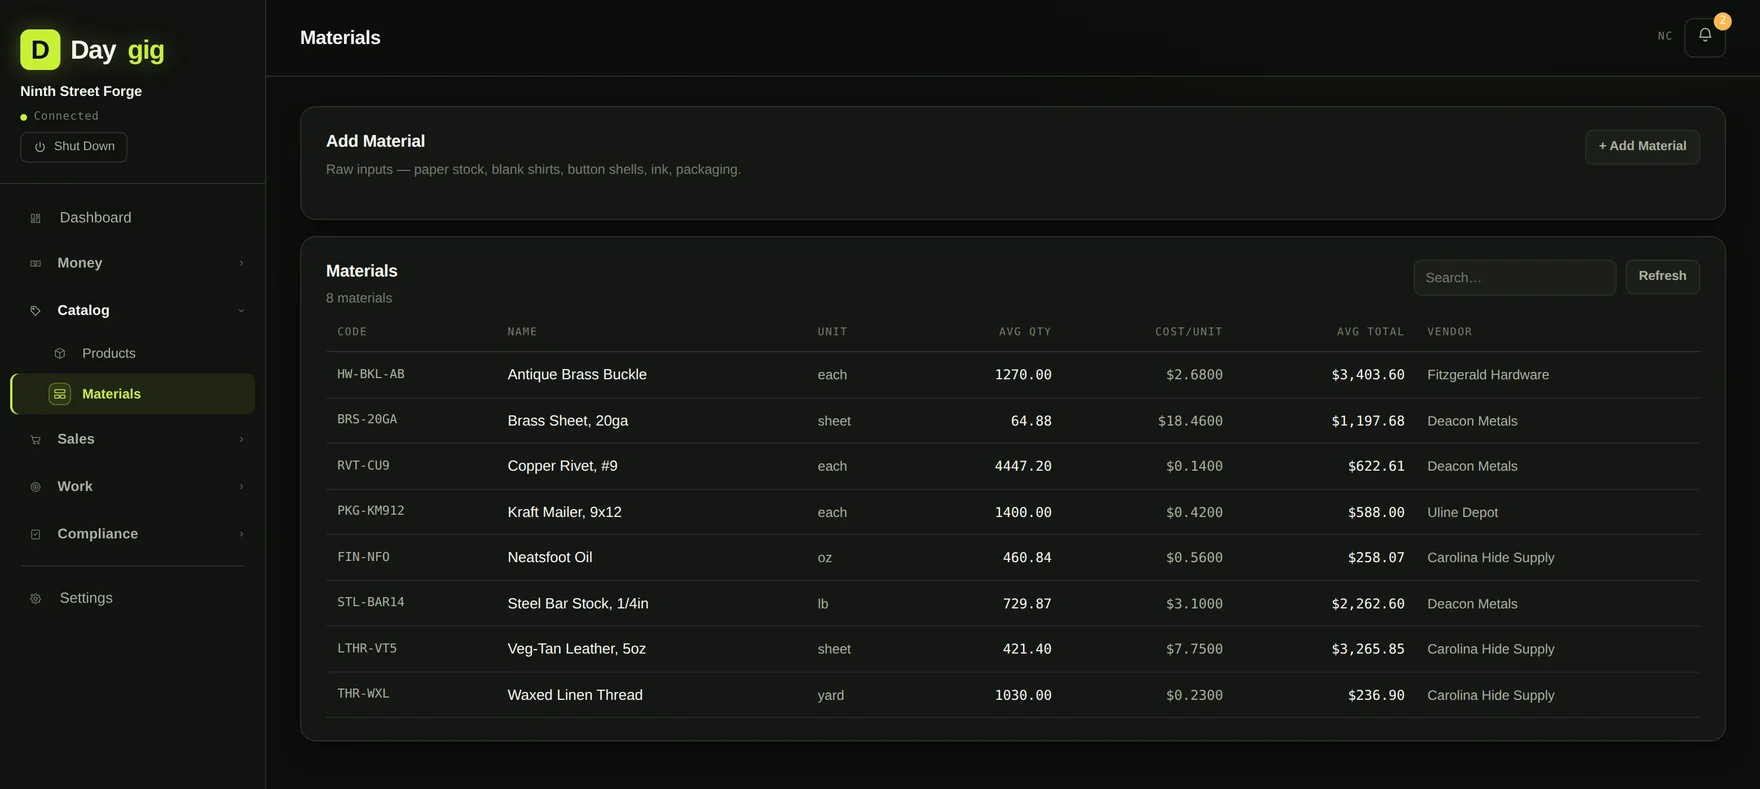
Every raw material carries an on-hand quantity, a supplier, and a weighted-average unit cost that updates as prices move. Buy leather at $7.40 a sheet and later at $8.15, and a belt built next week costs the blended figure, not whichever number you typed most recently.
Products with a bill of materials
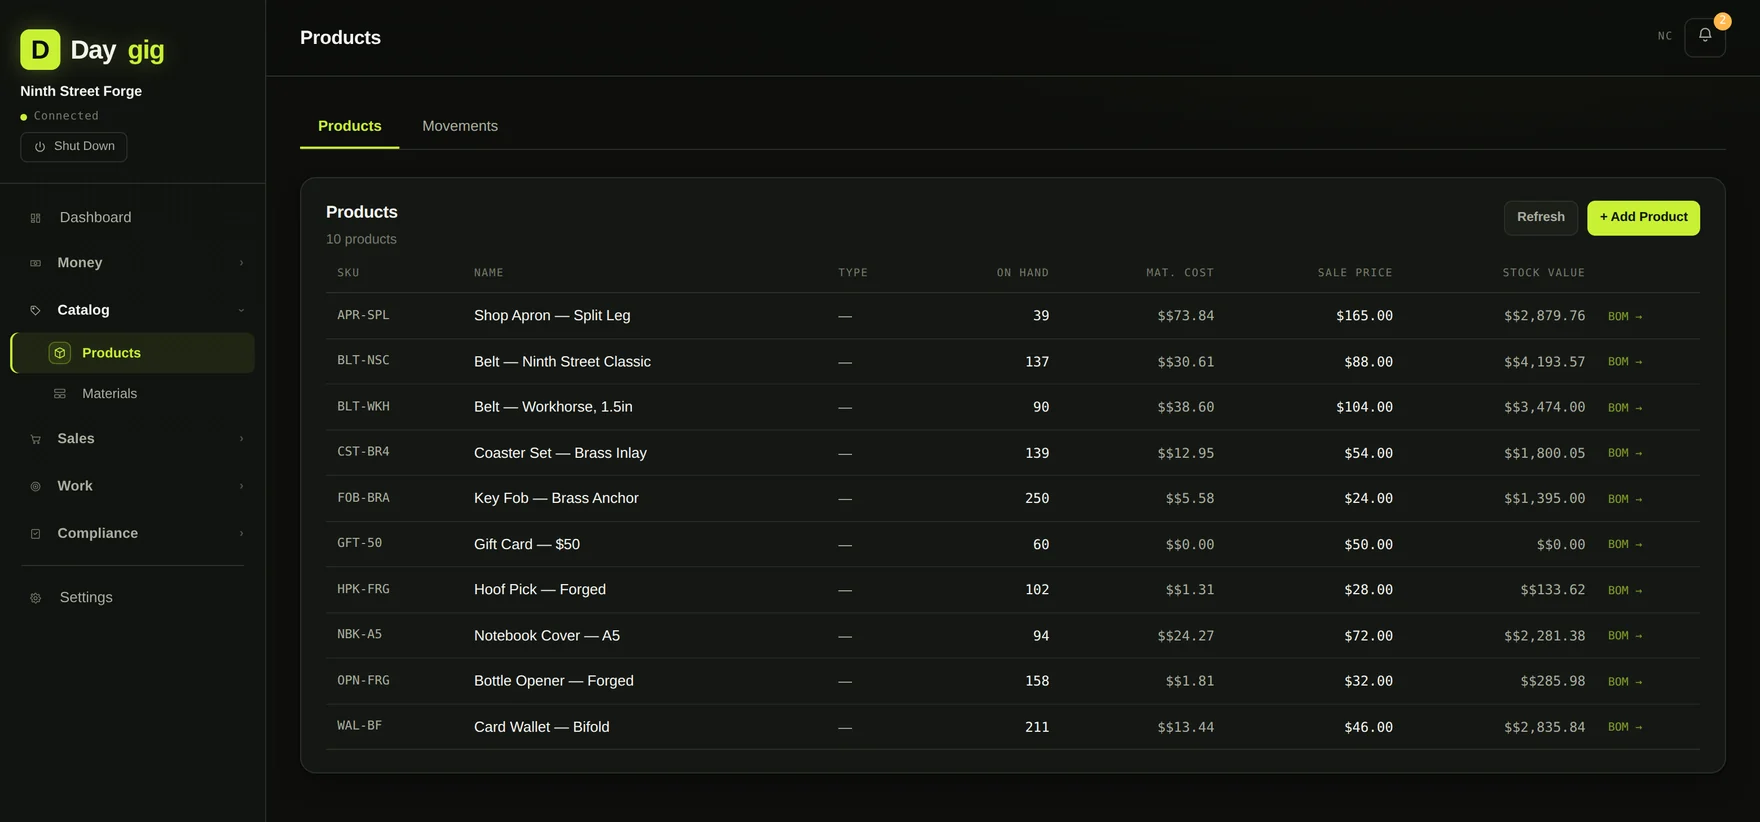
Each product carries the materials it consumes, with a waste factor per line. Record a production run and Daygig checks you have the stock, consumes it, and posts finished goods against raw materials at the rolled cost. Short on brass? The run is refused with the exact shortfall rather than quietly going negative.
07
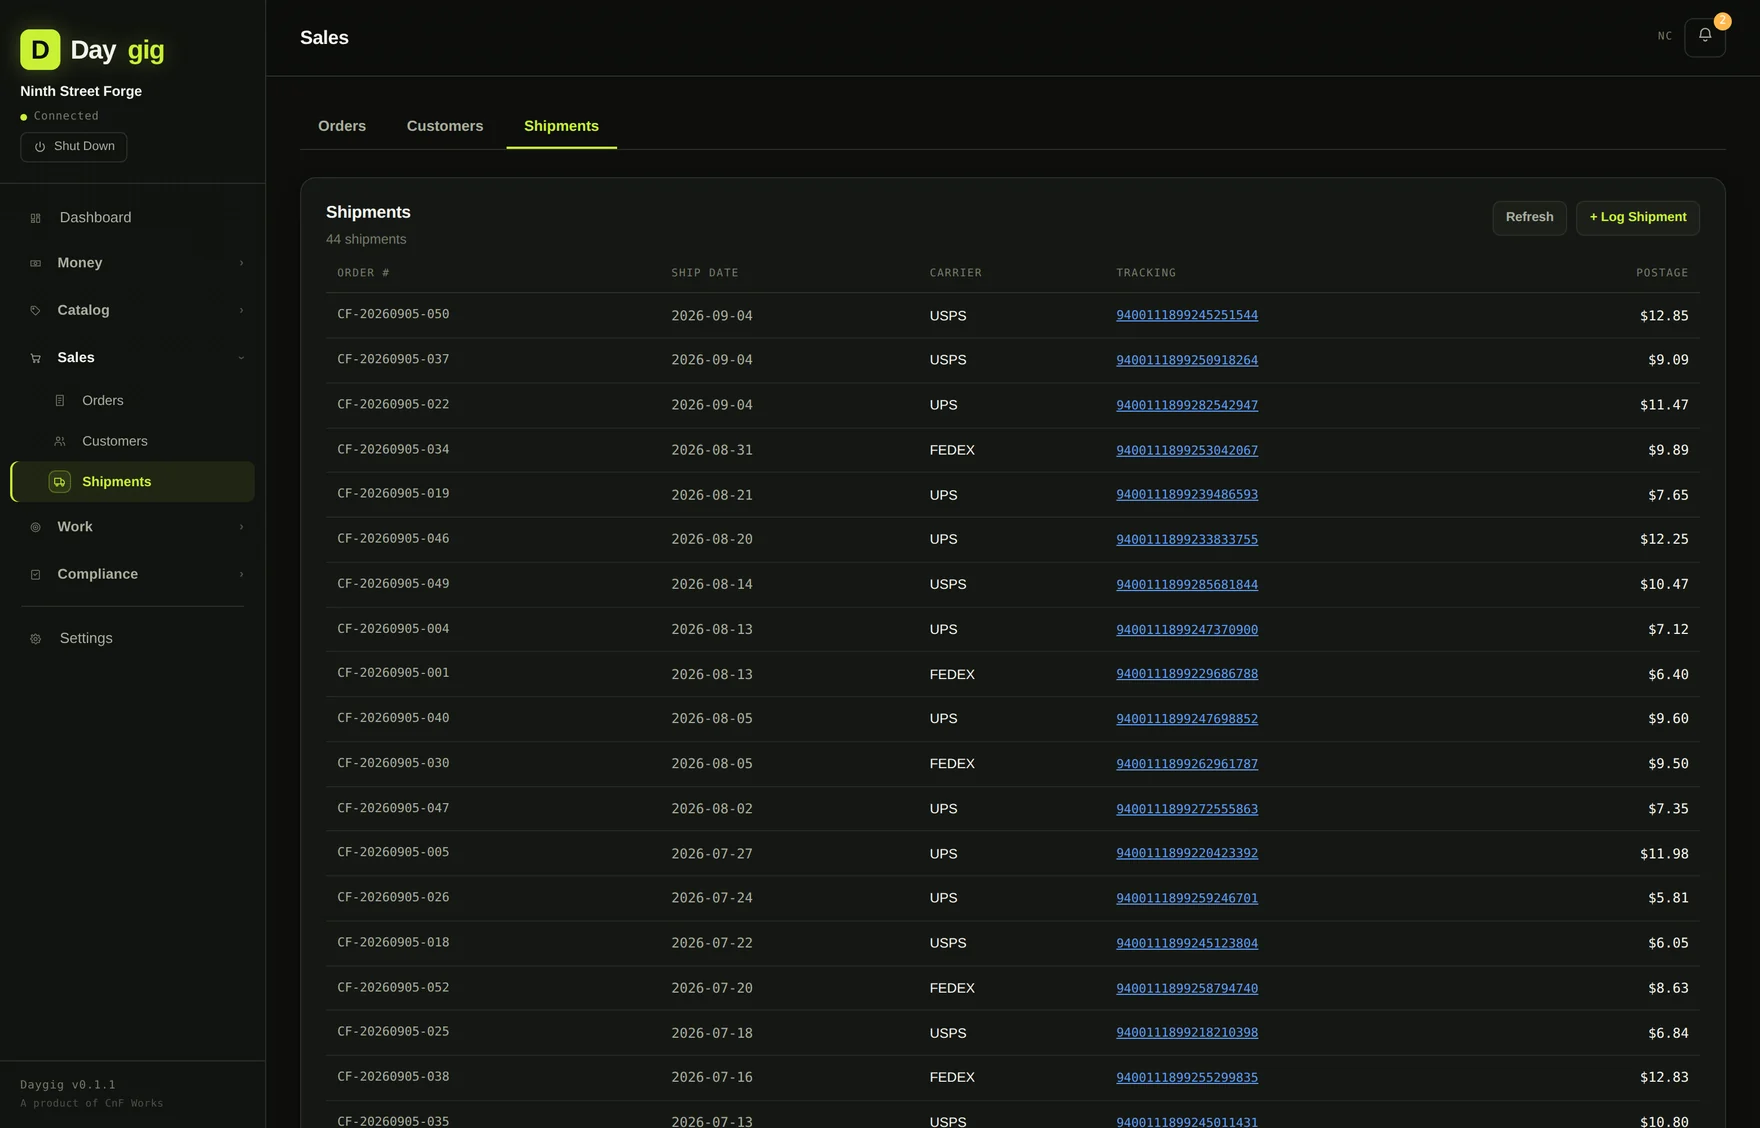
Orders, customers, shipments
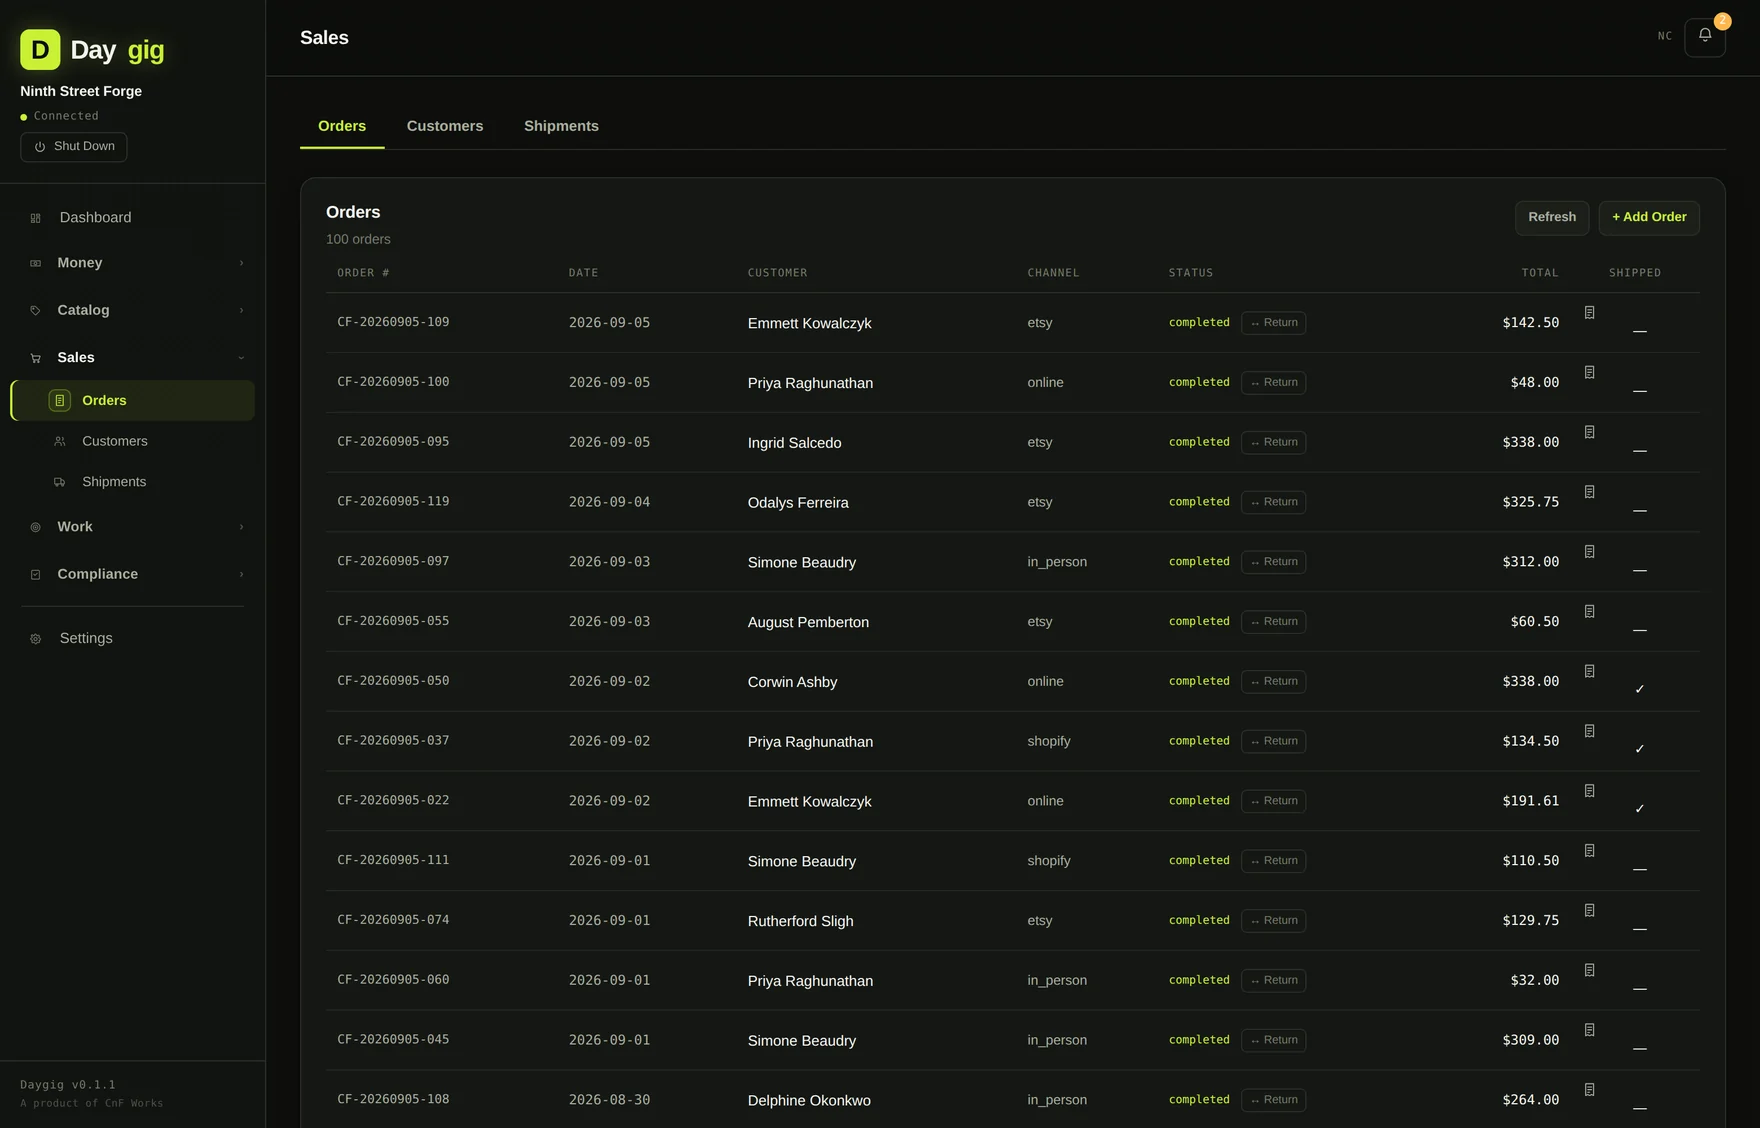
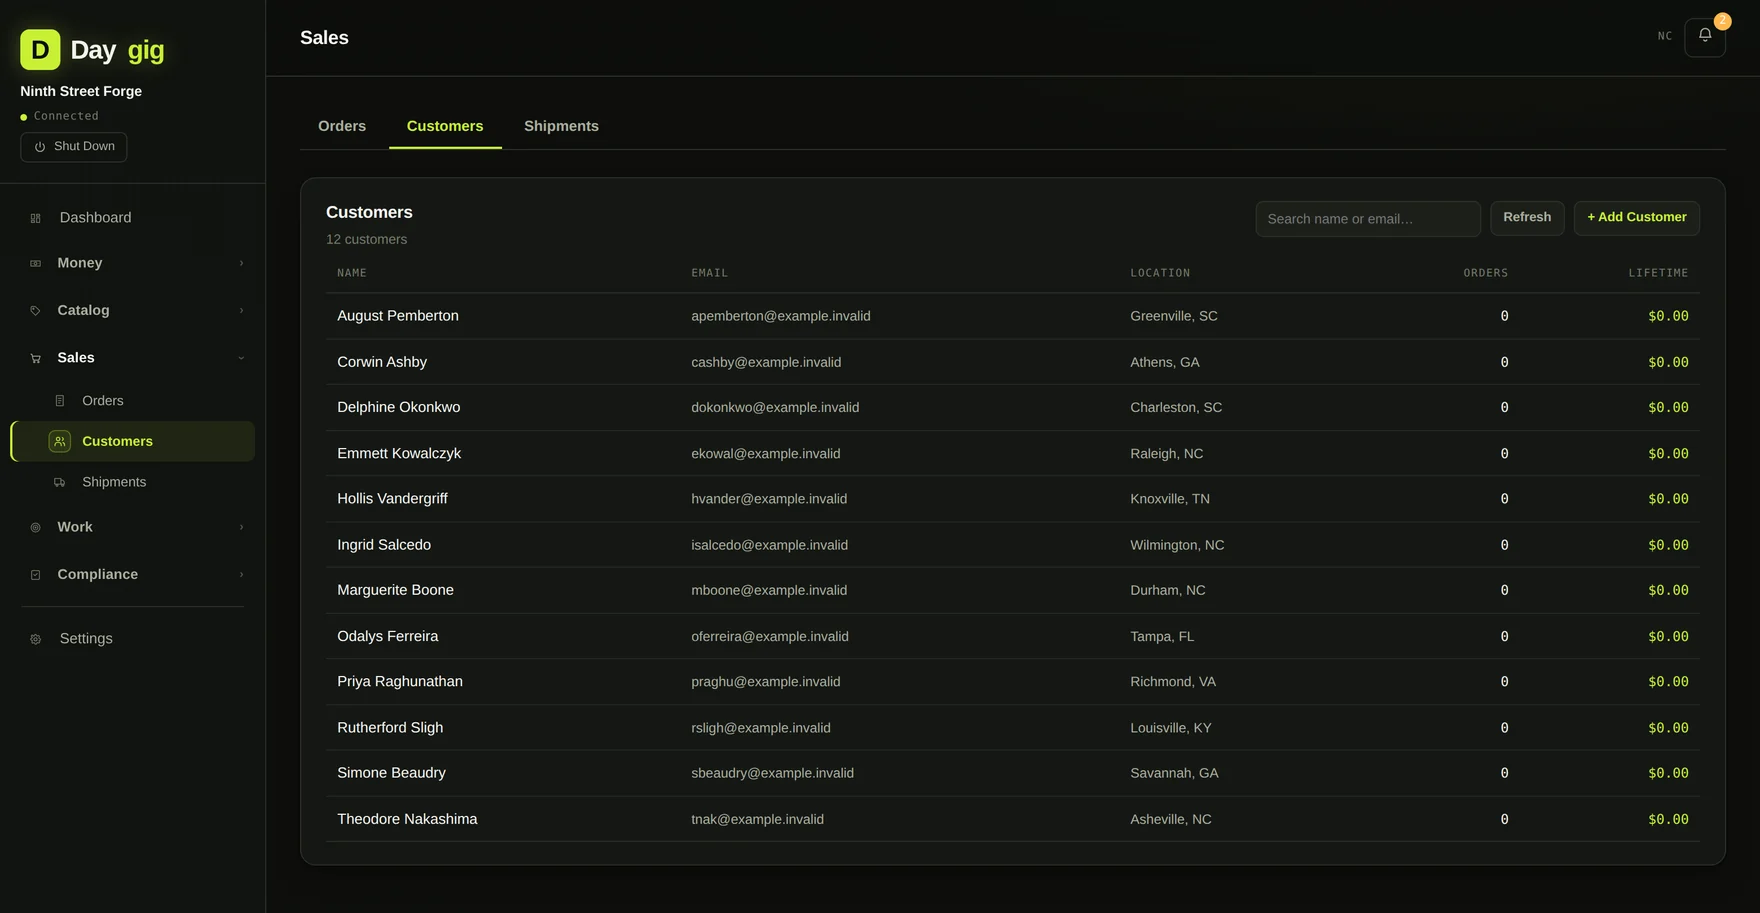
Record a sale through any channel (in person, your own site, Etsy, Shopify, wholesale) and the accounting happens behind it. Deposits on custom work are held as a liability until the balance is paid, which is correct and is the sort of thing that quietly matters when your accountant looks at December.
Refunds and returns are separate operations, because they are separate events. A refund reverses the money; a return also puts the unit back on the shelf or writes it off as spoilage.
08
Events and projects
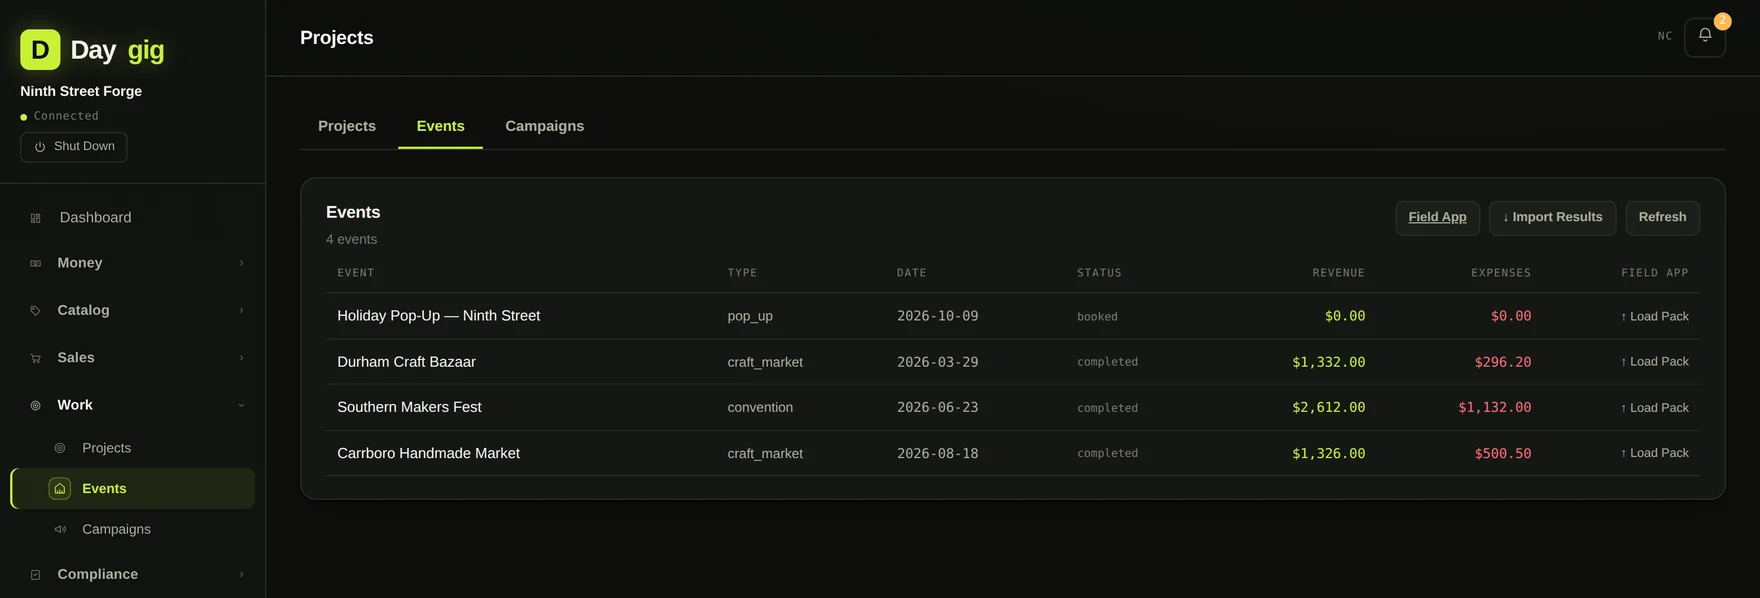
A craft fair is not a calendar entry. It is a small business operation with a booth fee, travel, two nights of lodging, meals, and a day of sales. The only question worth asking afterward is whether it was worth going.
Daygig treats each event as its own P&L. Log the costs, log the sales, and the answer is a number instead of a feeling. Do that for a season and you know which markets to book again and which ones to stop driving to.
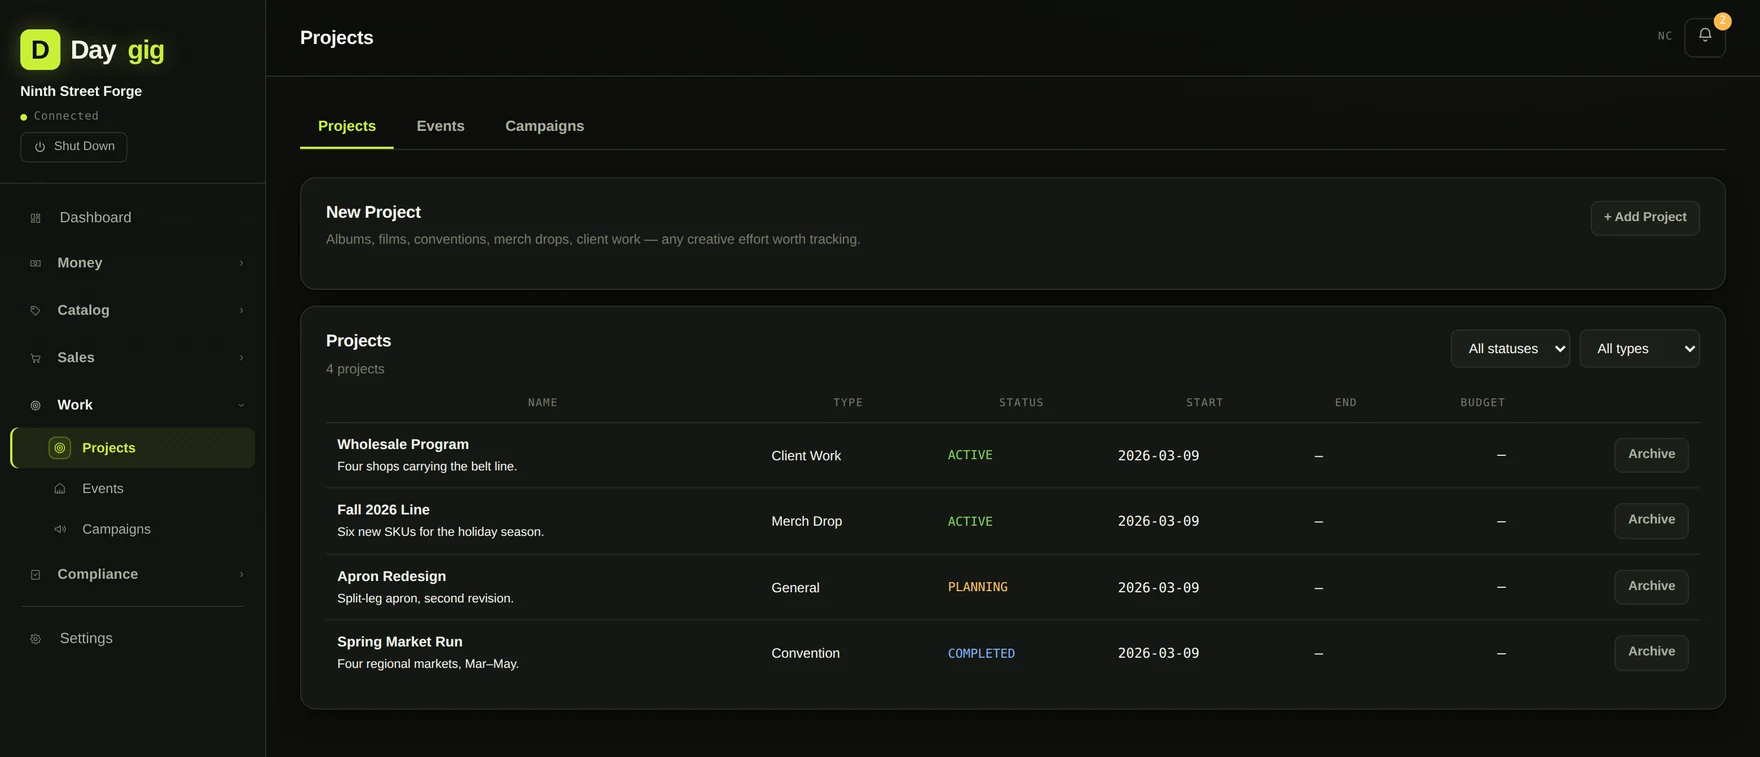
Projects group work that spans events and products (a product line, a wholesale program, a crowdfunding campaign) so a season's worth of activity rolls up somewhere sensible.
09
Jobs, estimates and invoices
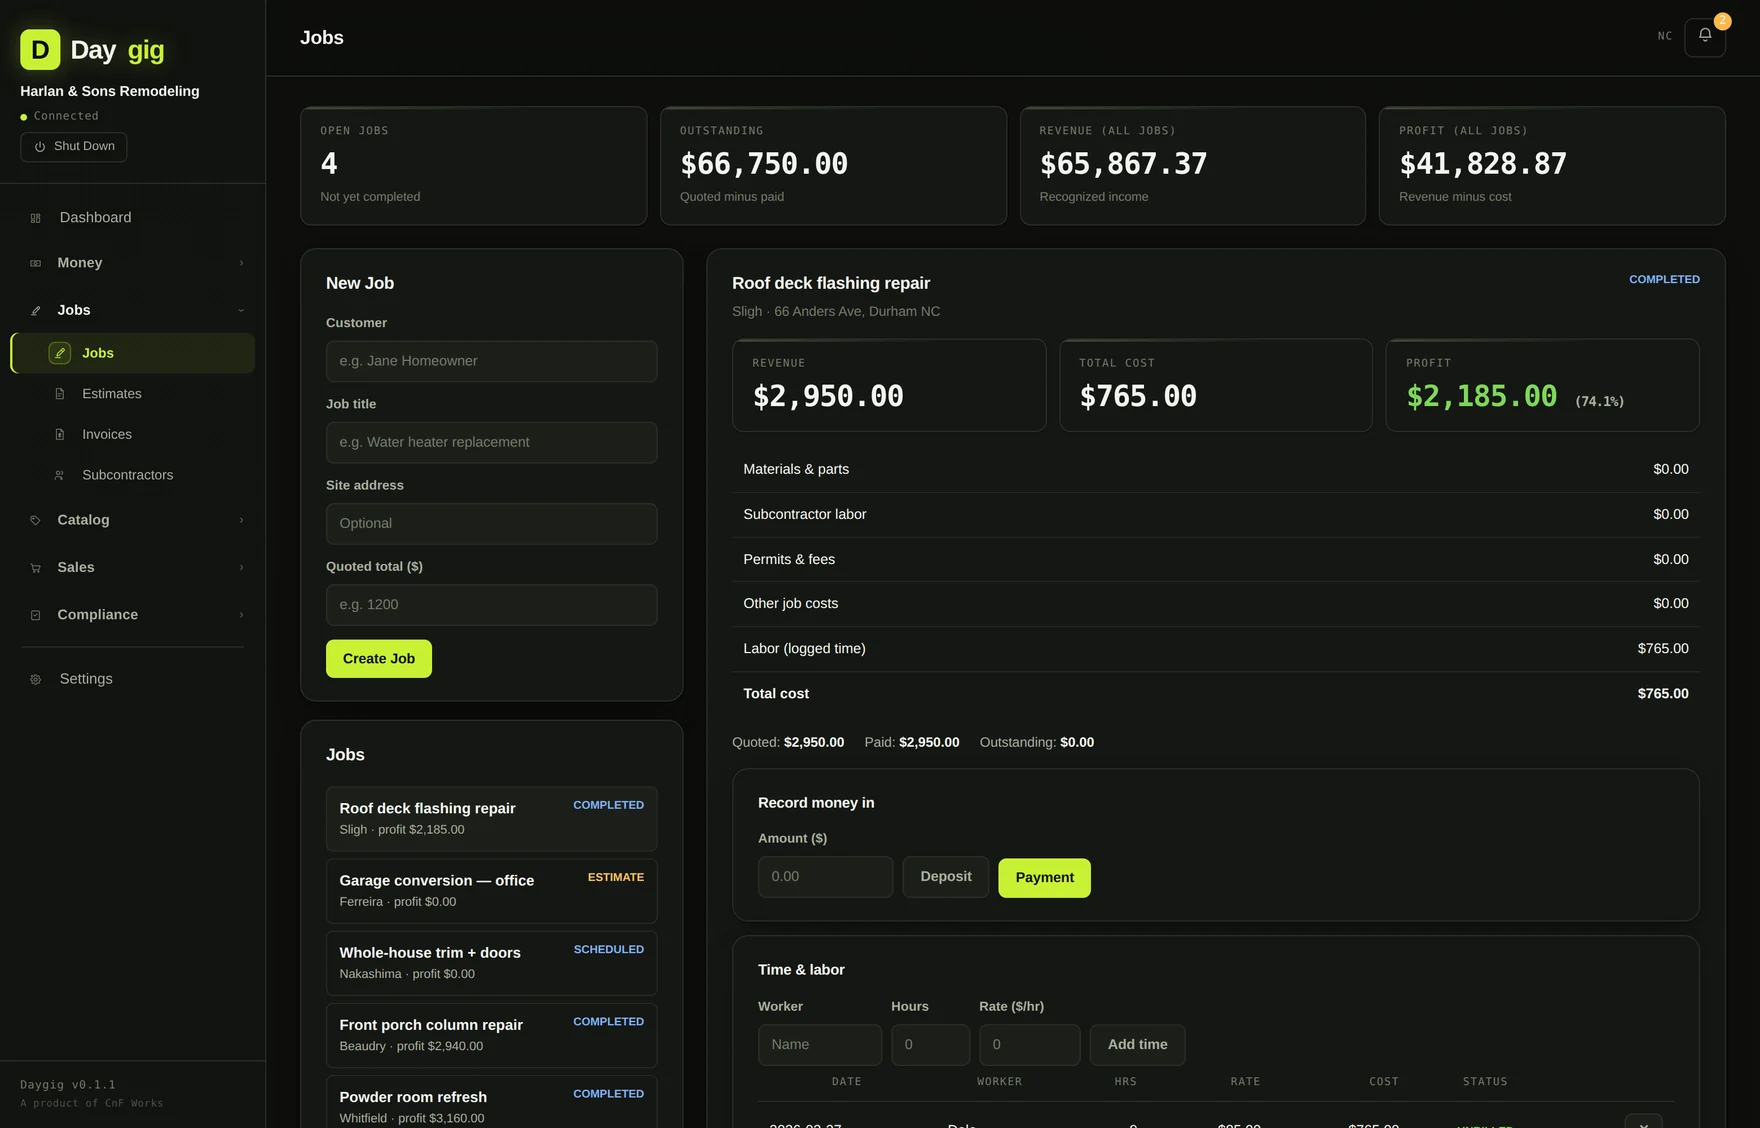
Contractor mode is built around one number that most job software refuses to show you: what the job actually made after materials, subcontractors, and your own hours.
Every job carries its costs, its logged time, its deposits and its payments. Open the list and each job shows its real profit next to it, including the ones that are underwater, which is the entire point of tracking it.
Estimates that become invoices
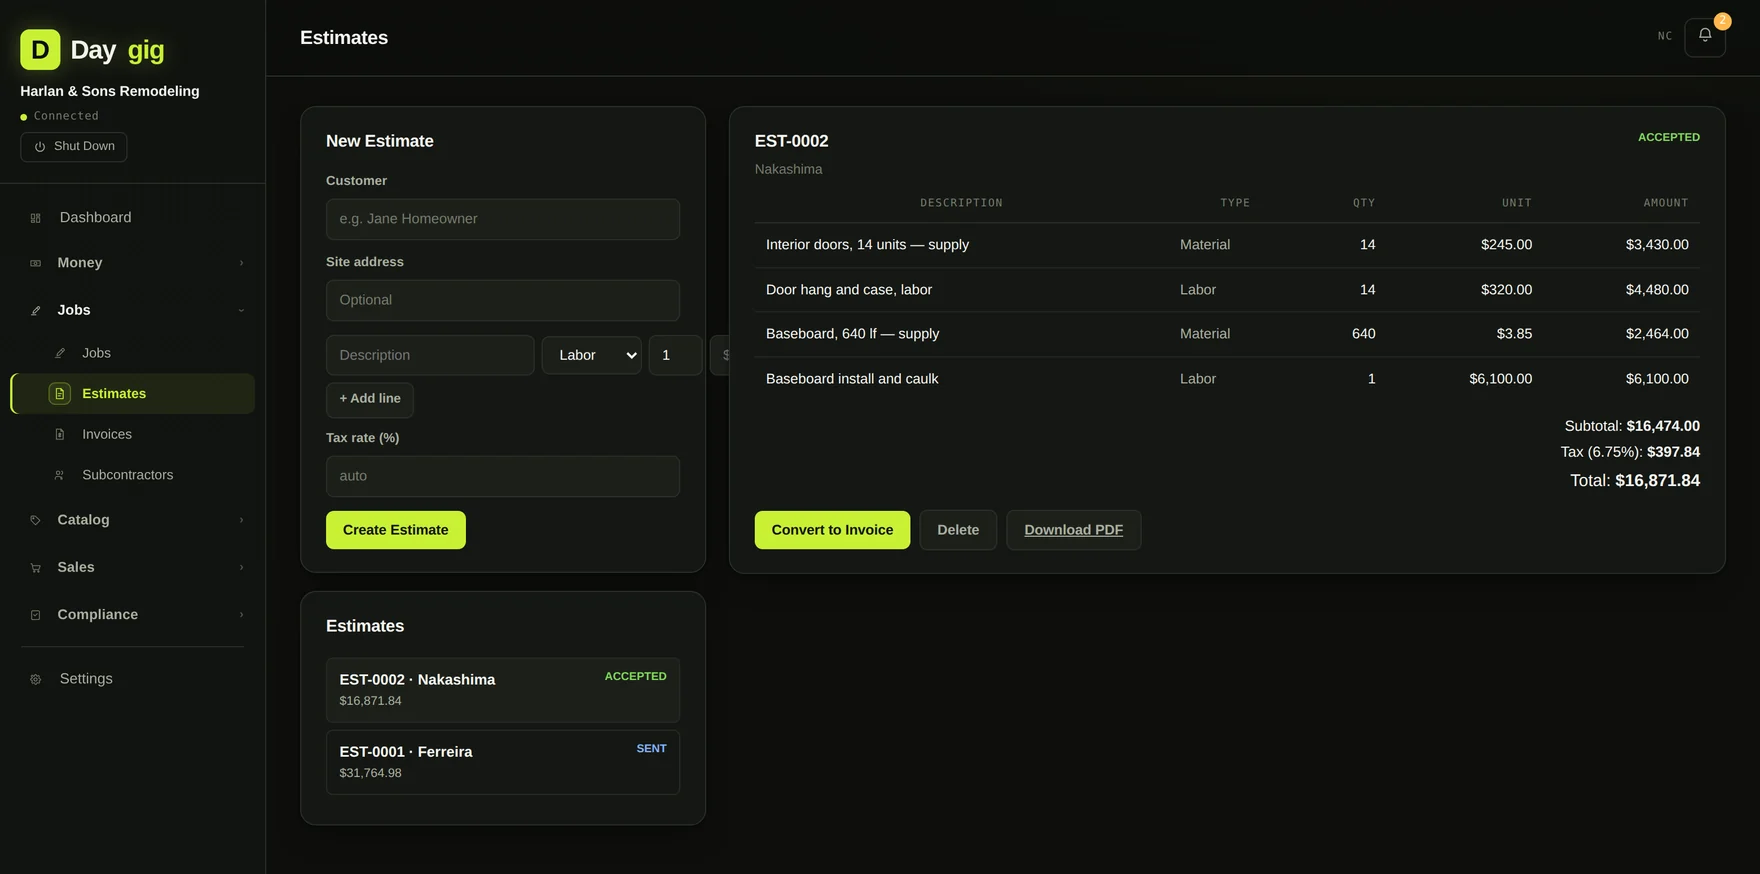
Write an estimate with line items marked as labor or materials, send it as a PDF, and convert it to an invoice when they say yes. Nothing gets retyped.
Invoices with honest balances
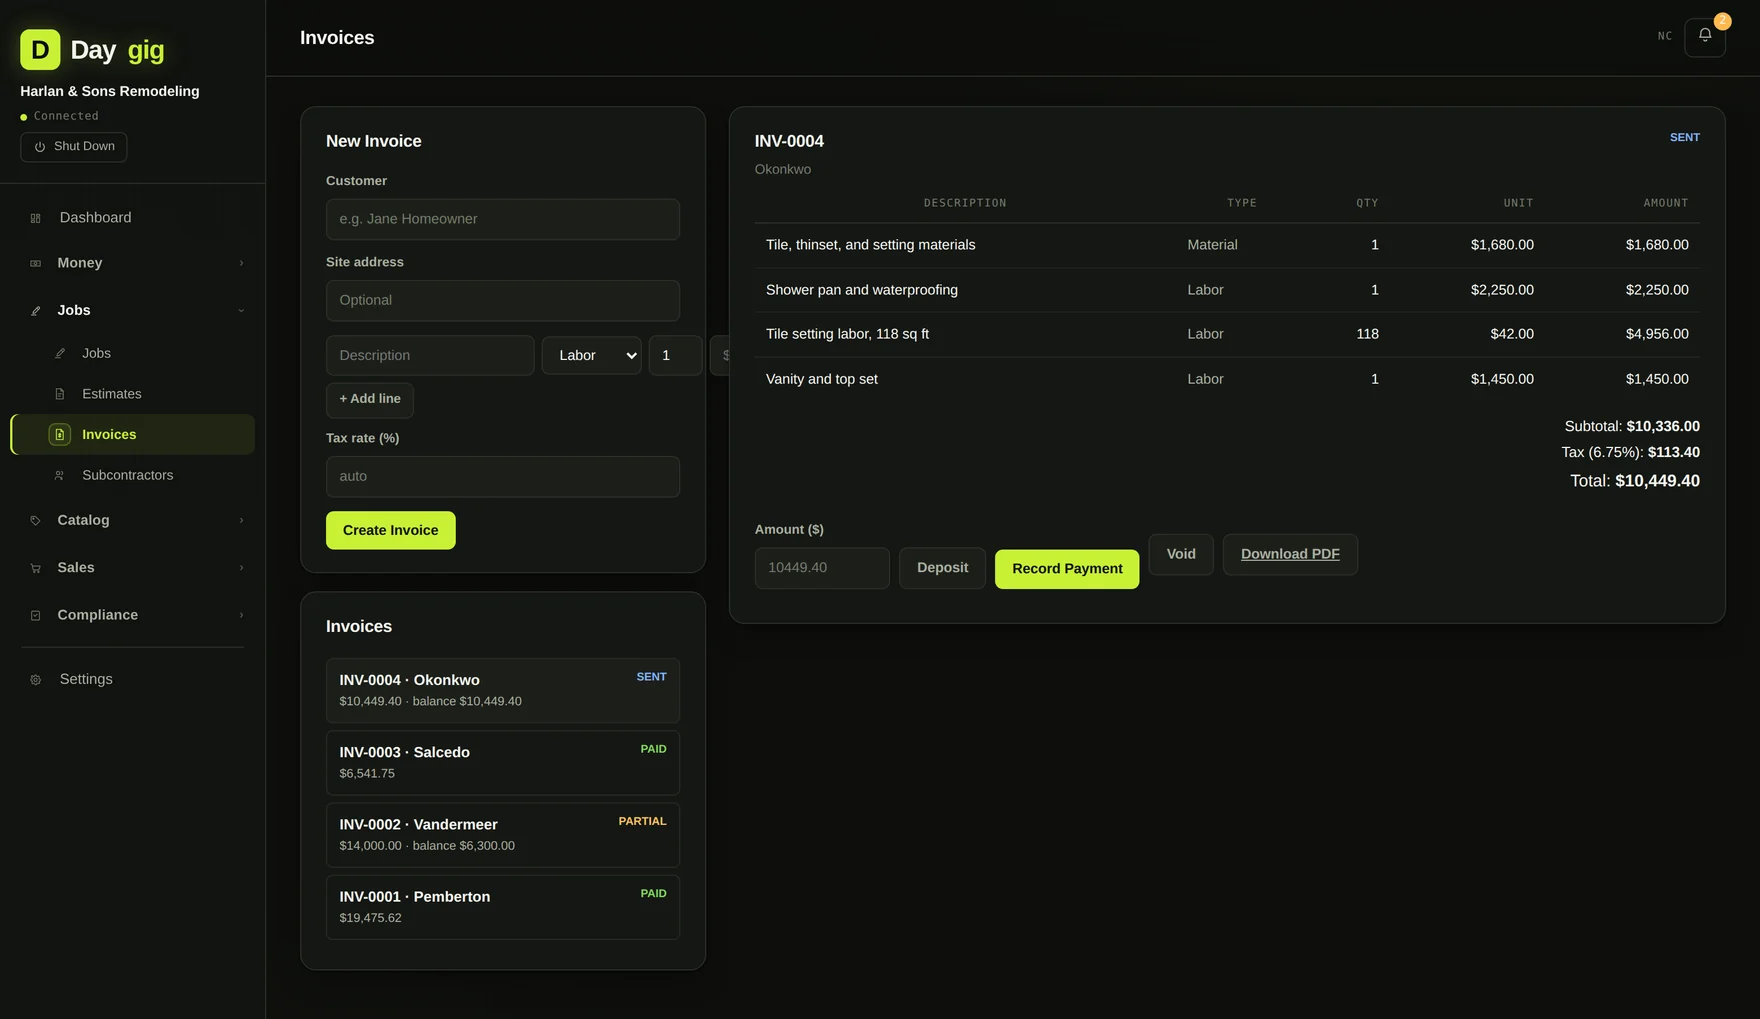
Invoices move through draft, sent, partial and paid, and record payments against the balance rather than flipping a flag. A partially paid invoice shows what is still outstanding, because that is the number you need when you're deciding who to call.
Subcontractors and the 1099 trail
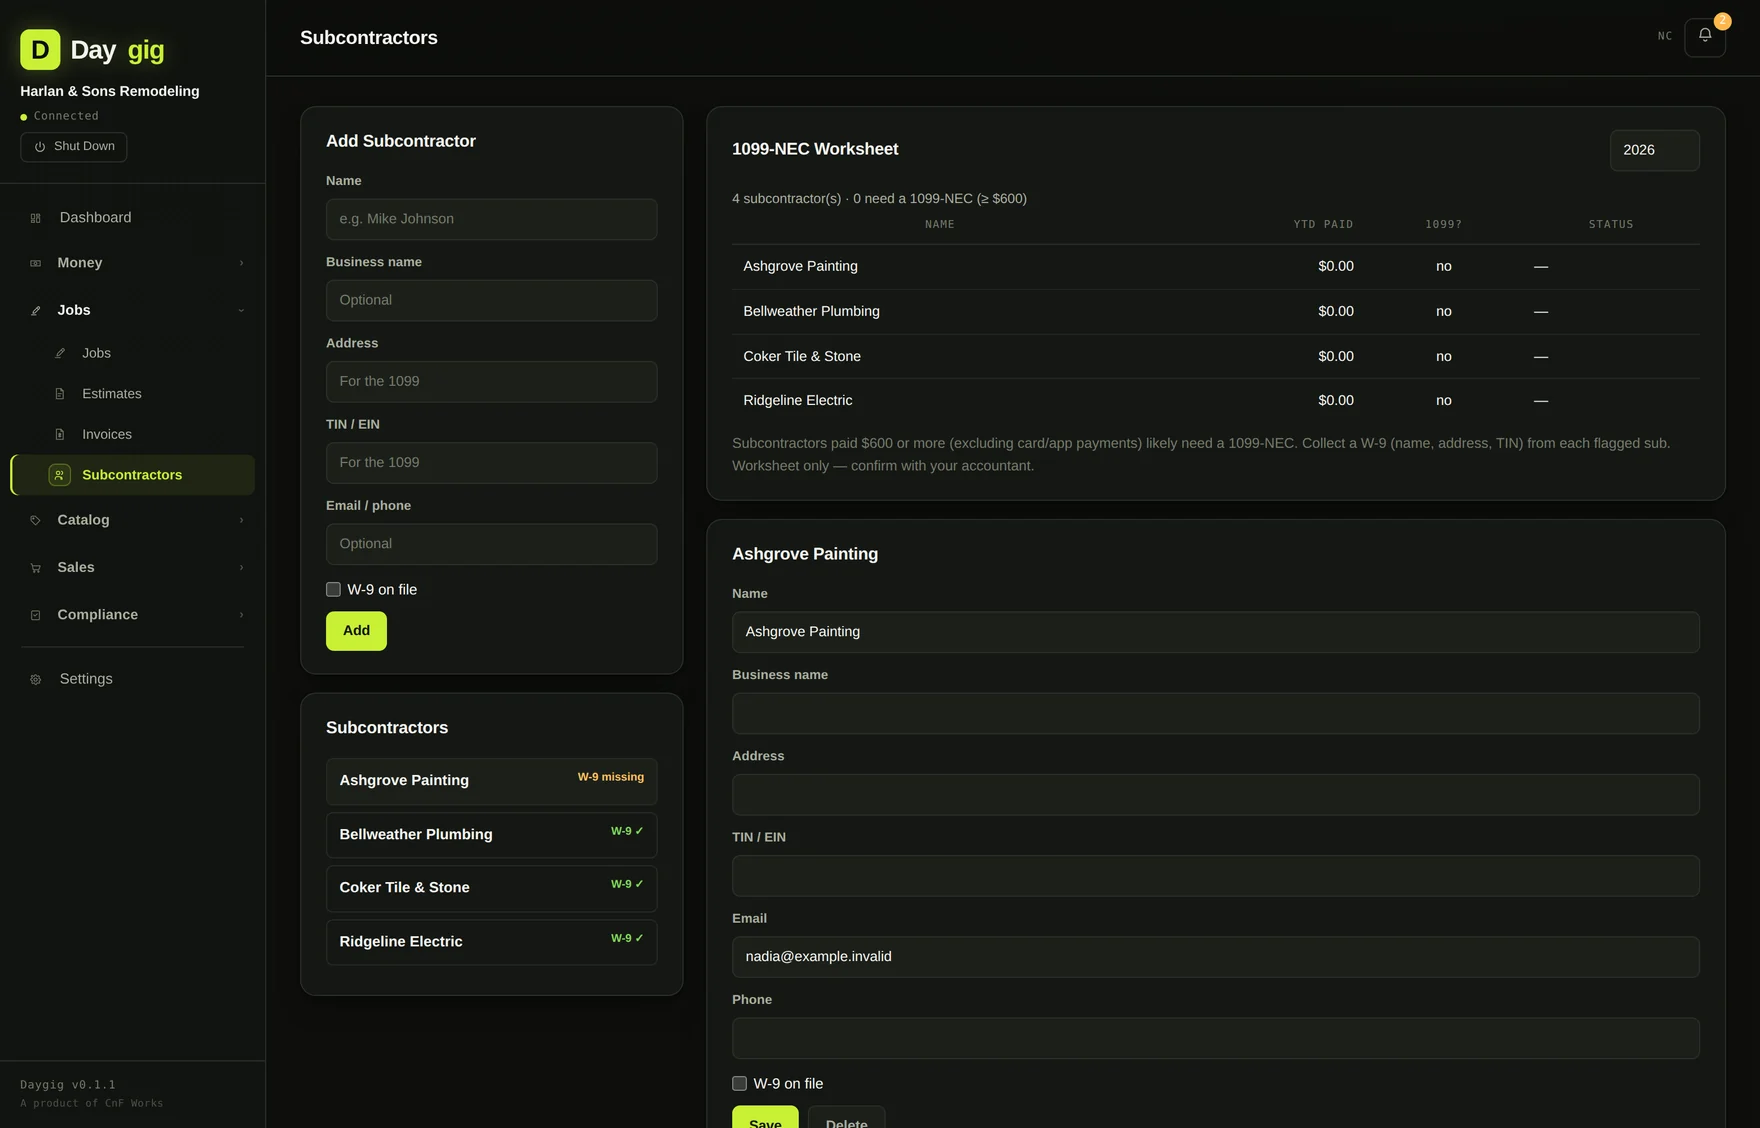
Track who you paid, whether their W-9 is on file, and how much they've received this year. Daygig totals it against the $600 threshold and excludes payments made by card or payment app, since those get reported by the processor instead. That exclusion is easy to miss by hand and double-reports someone's income when you do.
10
Property, leases and rent
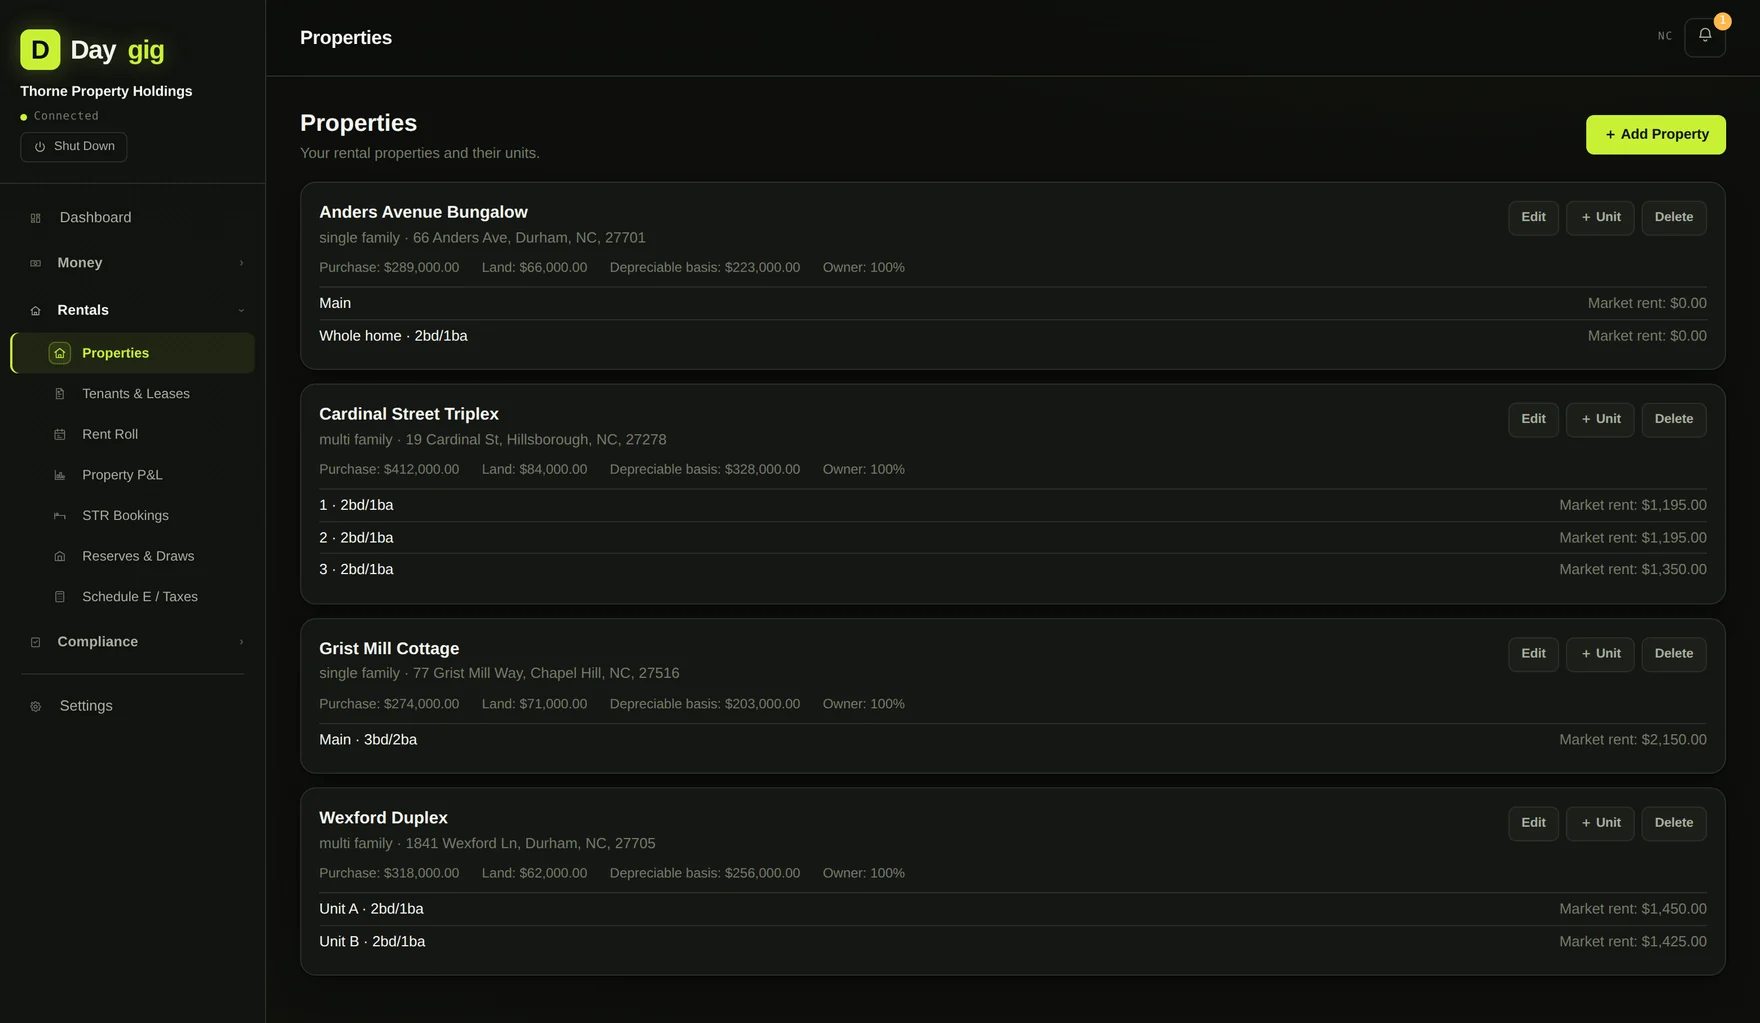
Landlord mode carries each property with its purchase price, land value, depreciable basis, in-service date, and its units. Multi-family properties hold multiple units; each unit holds a lease; each lease generates rent charges.
Rent roll
Each month generates a rent roll from the active leases. Mark payments as they land and the screen tells you what was billed, what came in, and what's still out, per unit, with the late ones obvious.
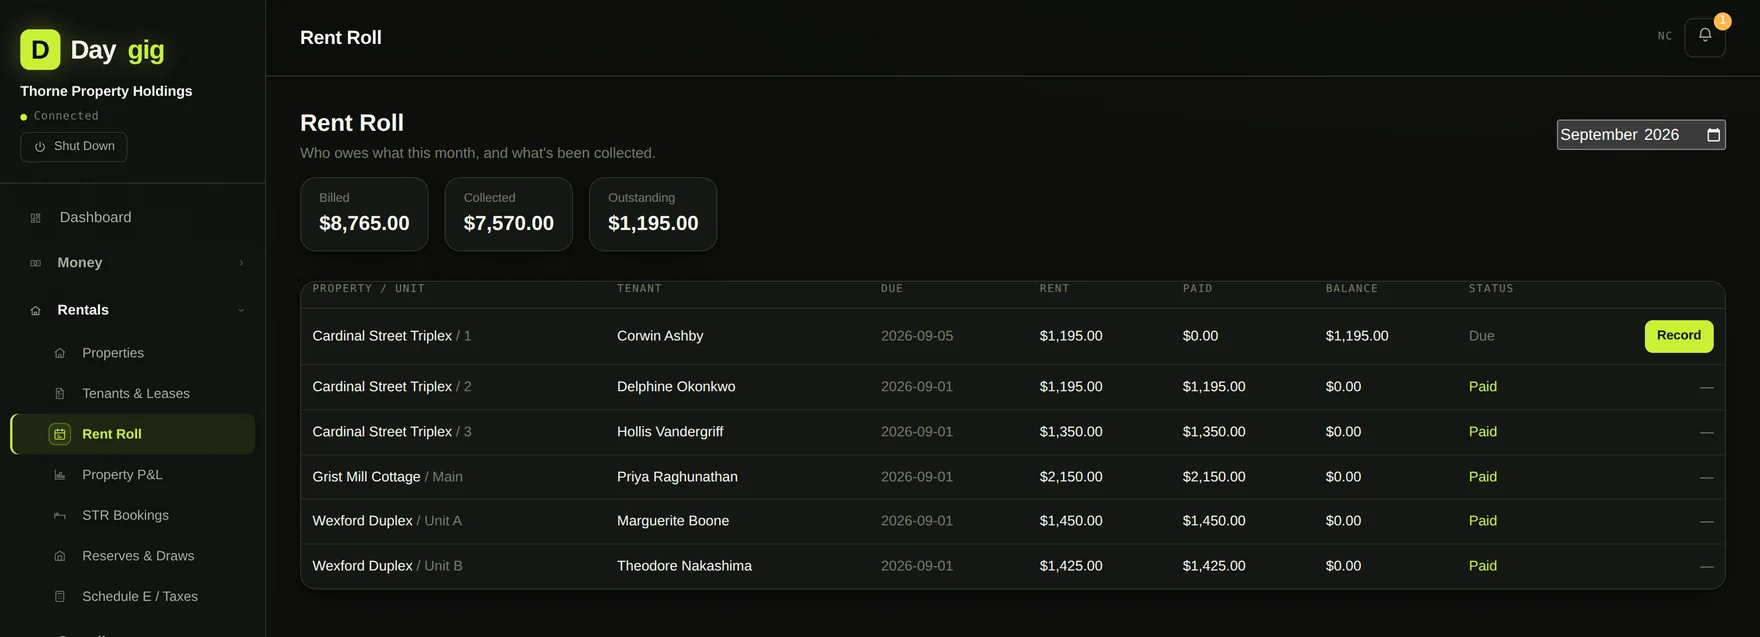
Security deposits are held as a liability, not booked as income, because a deposit is money you are holding for someone else, and treating it as revenue overstates your year and understates what you owe back.
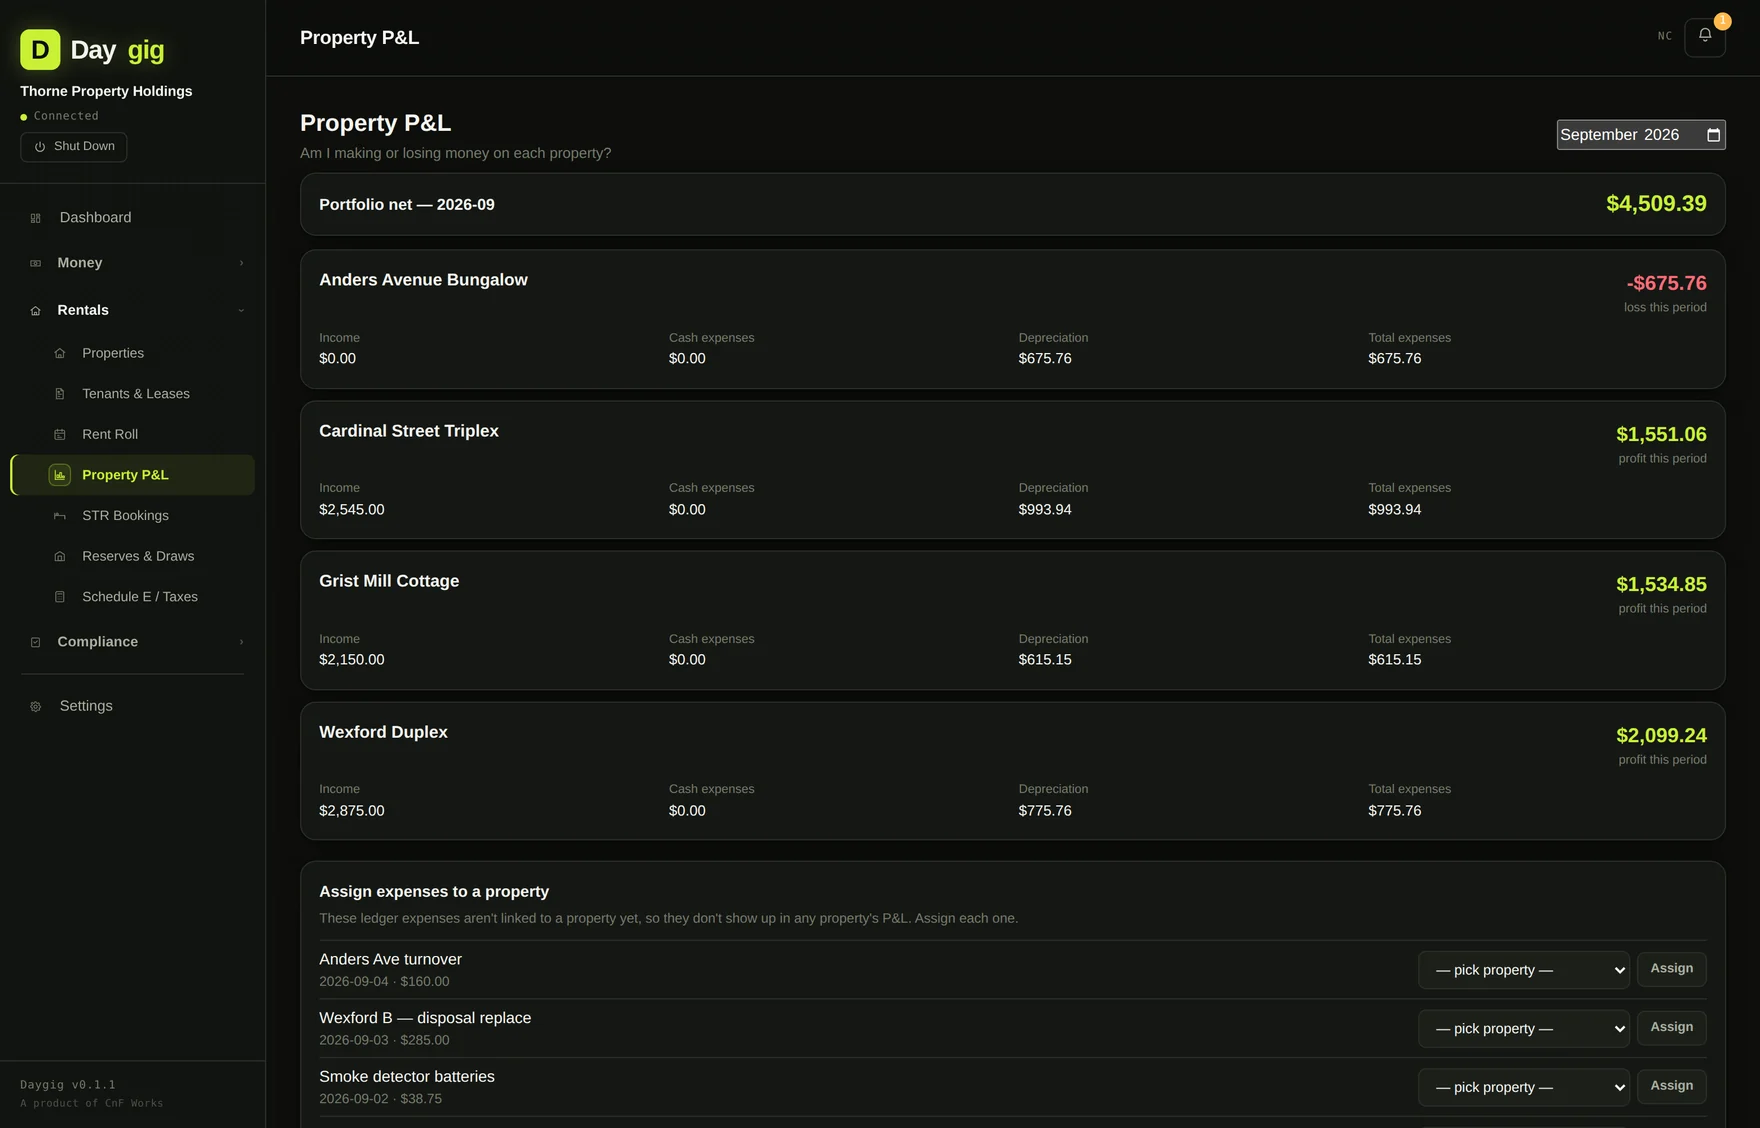
Per-property profit and loss
Portfolio totals hide the property that's bleeding. Daygig reports income and expenses per property so you can see which one is carrying the others.
Capital reserves
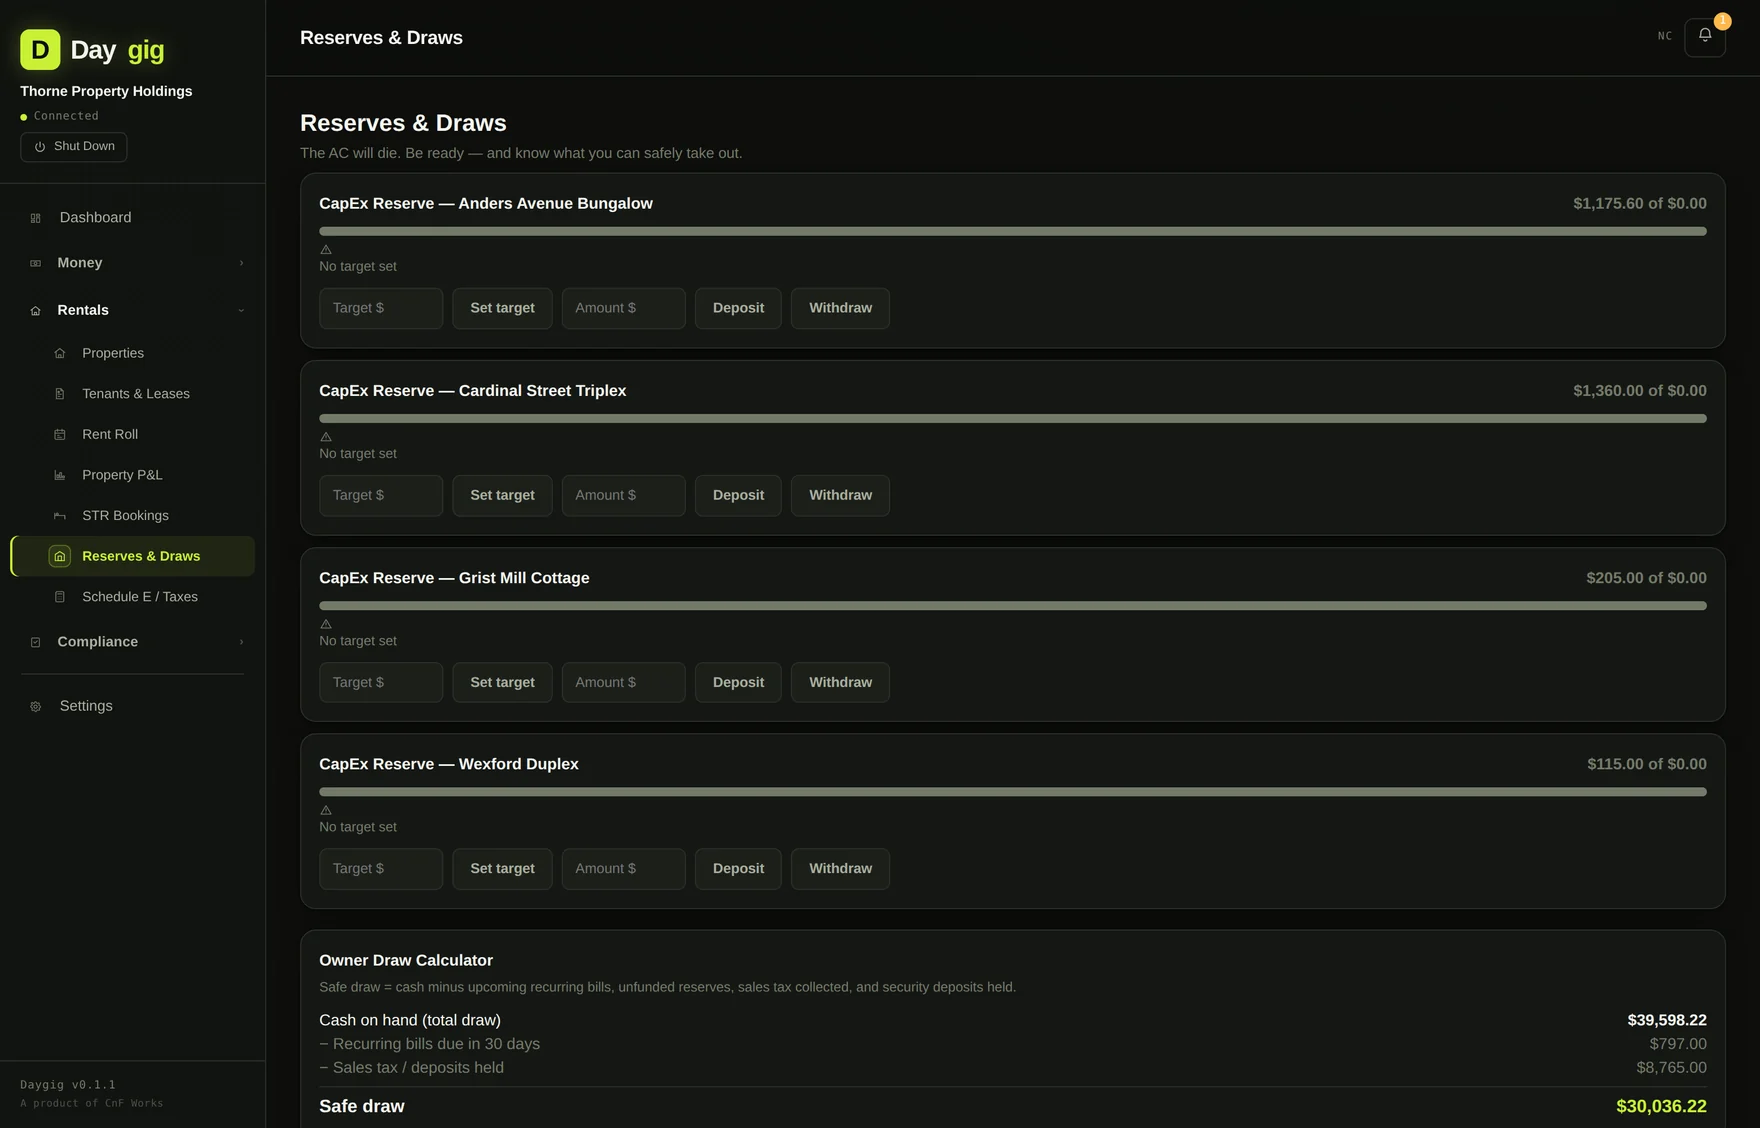
The roof, the water heater and the HVAC are not surprises. They are scheduled expenses you haven't dated yet. Set a monthly reserve target per property, record what you set aside and what you drew, and the screen tells you whether you are actually funded or just telling yourself you are.
11
Short-term rental profitability
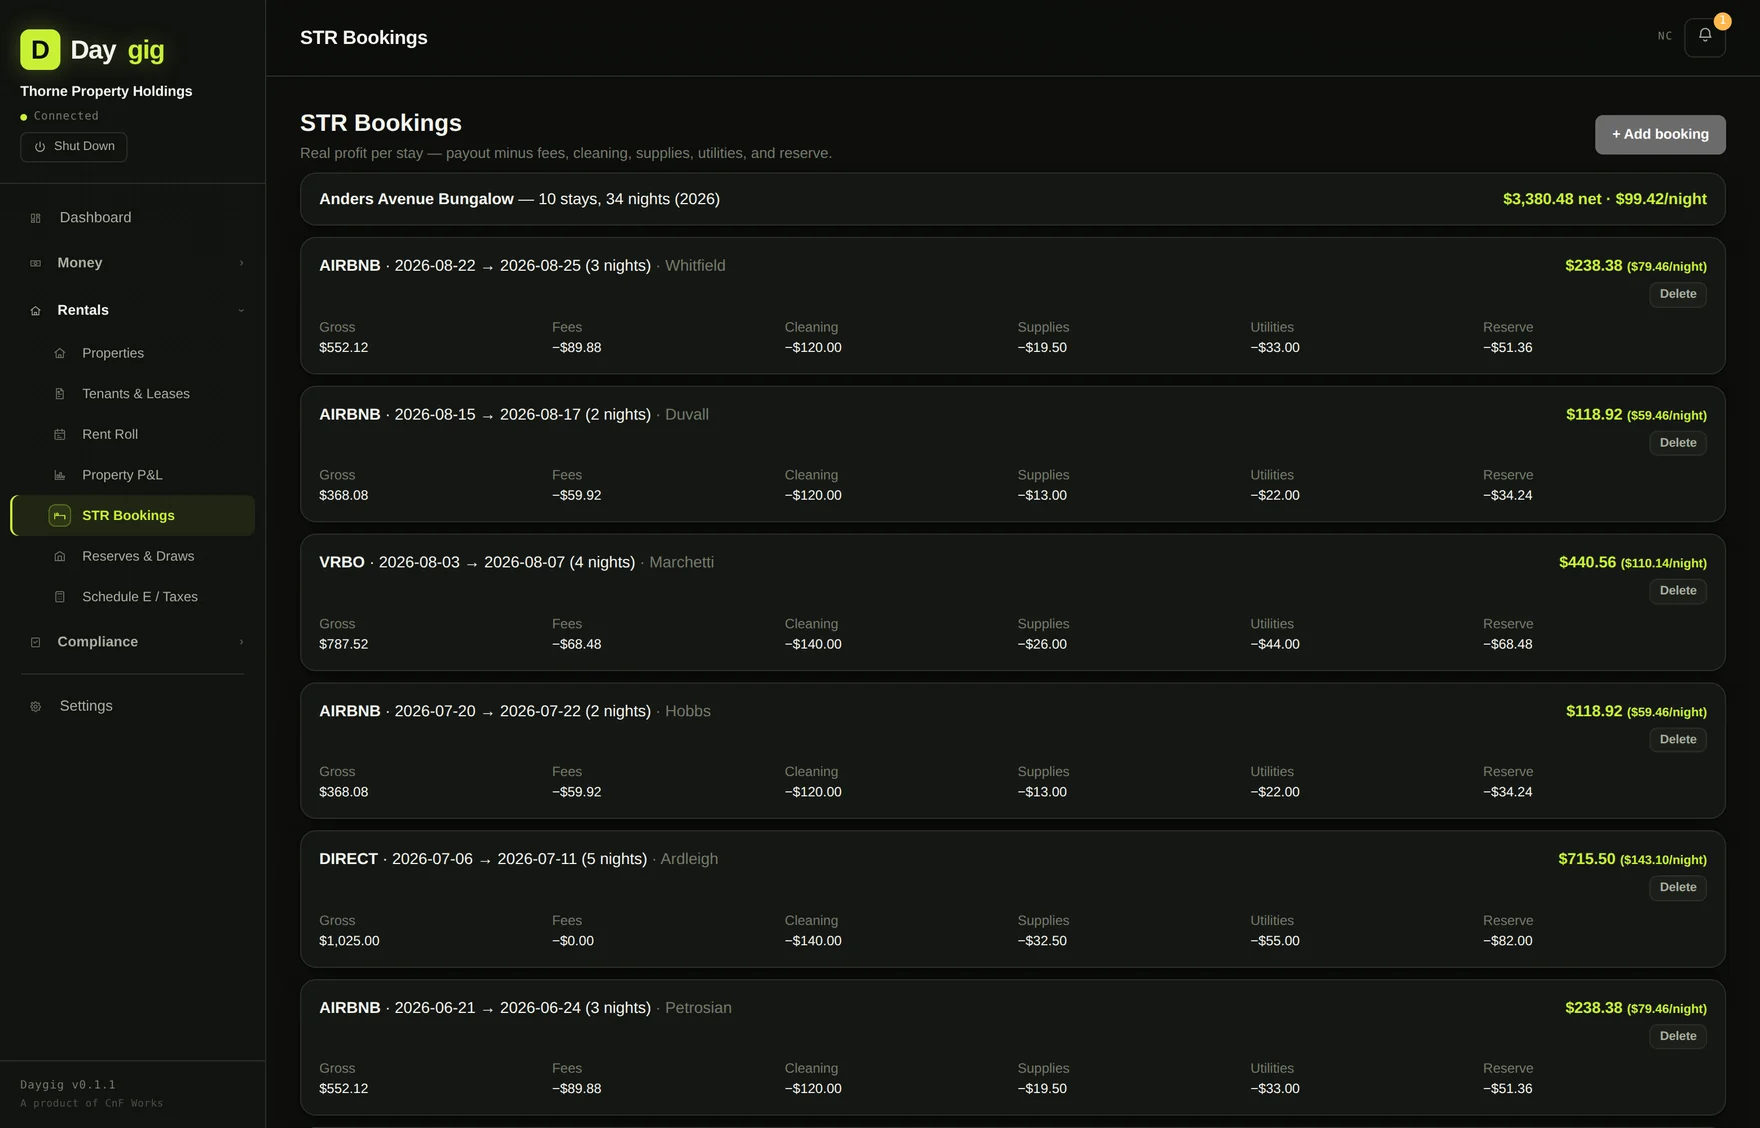
The gross payout on an Airbnb booking is not what you made. Daygig breaks each stay down into what it actually was: gross, platform fees, cleaning, supplies, an estimated utility share, and the reserve allocation. Then it divides by nights, so you get real profit per night rather than a headline rate.
Run that across a season and the pattern shows up. The two-night bookings that felt busy may be the ones losing to turnover cost, and the direct bookings that skip the platform fee may be worth the extra effort of taking them.
12
Tax and compliance
Deadlines
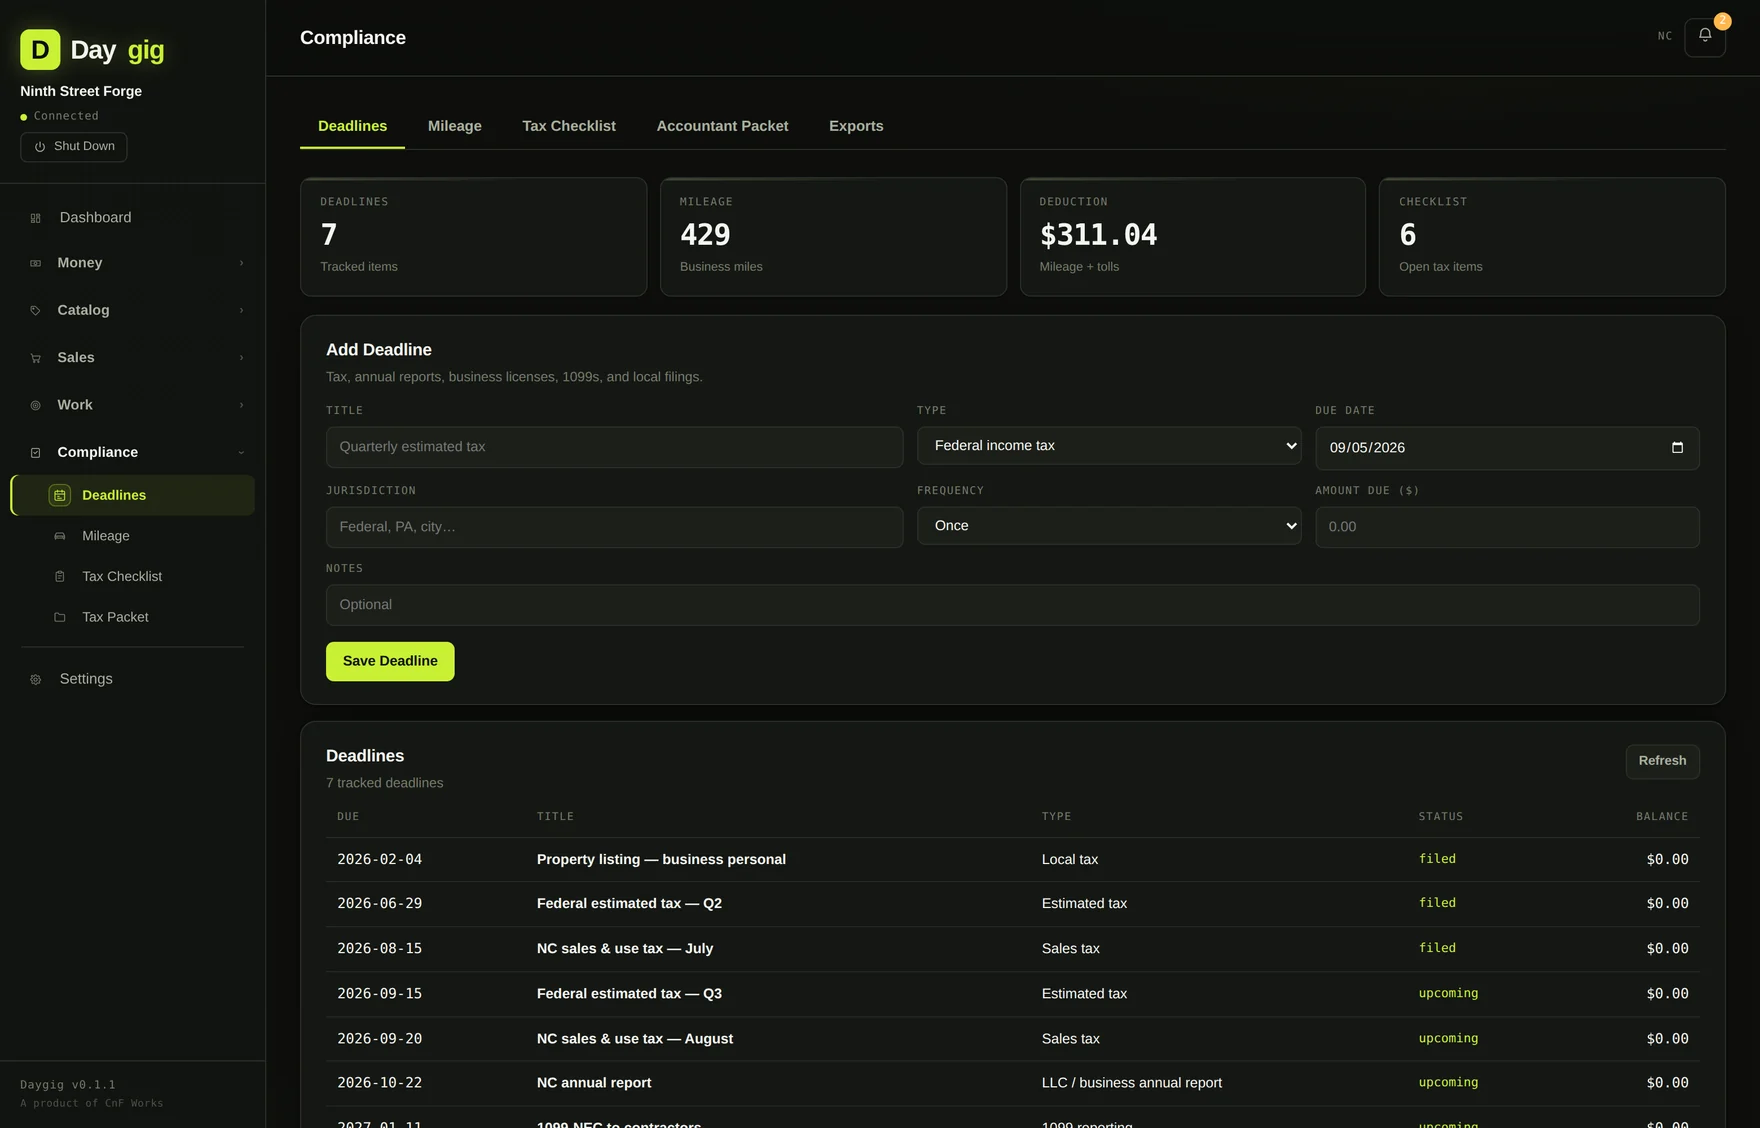
Quarterly estimates, sales tax filings, annual reports, 1099 deadlines, all tracked with status and due date, so the thing you forget is on a screen instead of a sticky note.
Mileage
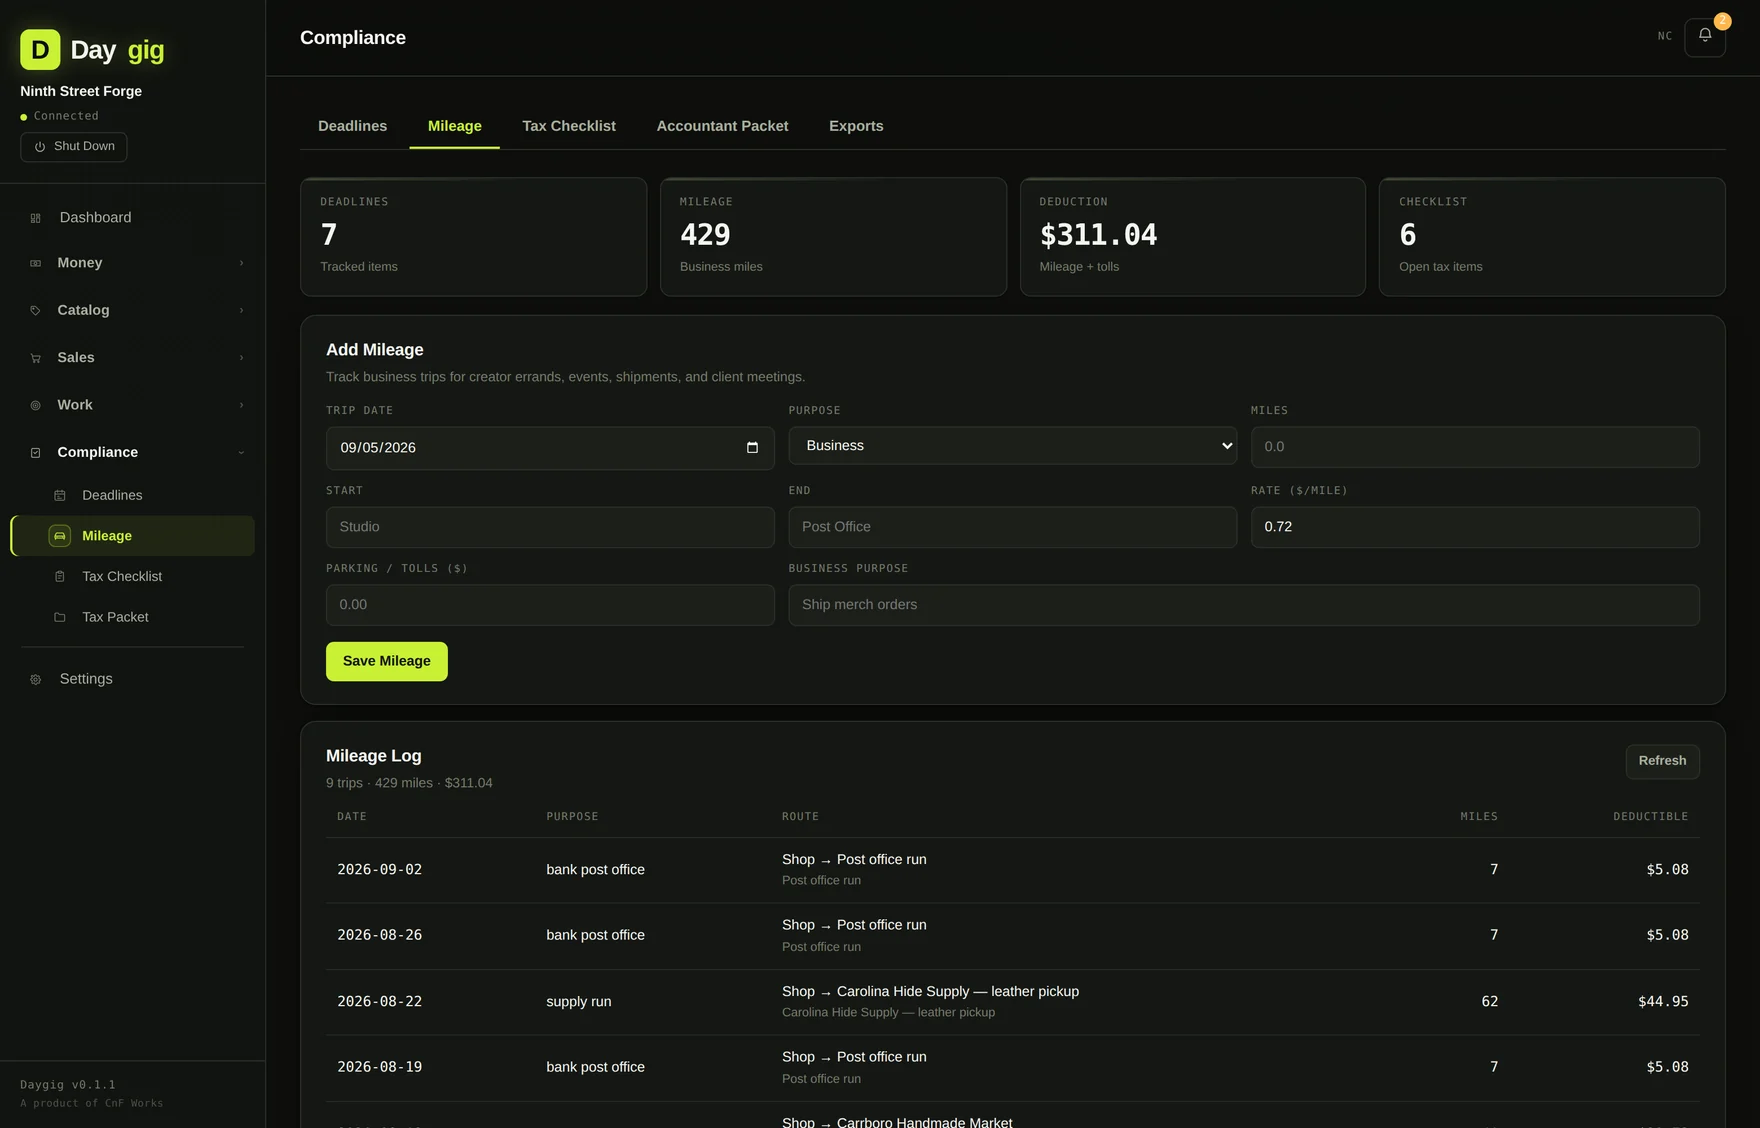
Log a trip with its purpose and Daygig values it at the IRS standard rate for that trip's year, including years the rate changed mid-year. The log is exportable in the form the IRS wants: date, destination, business purpose, miles, and deduction.
Tax checklist and accountant packet
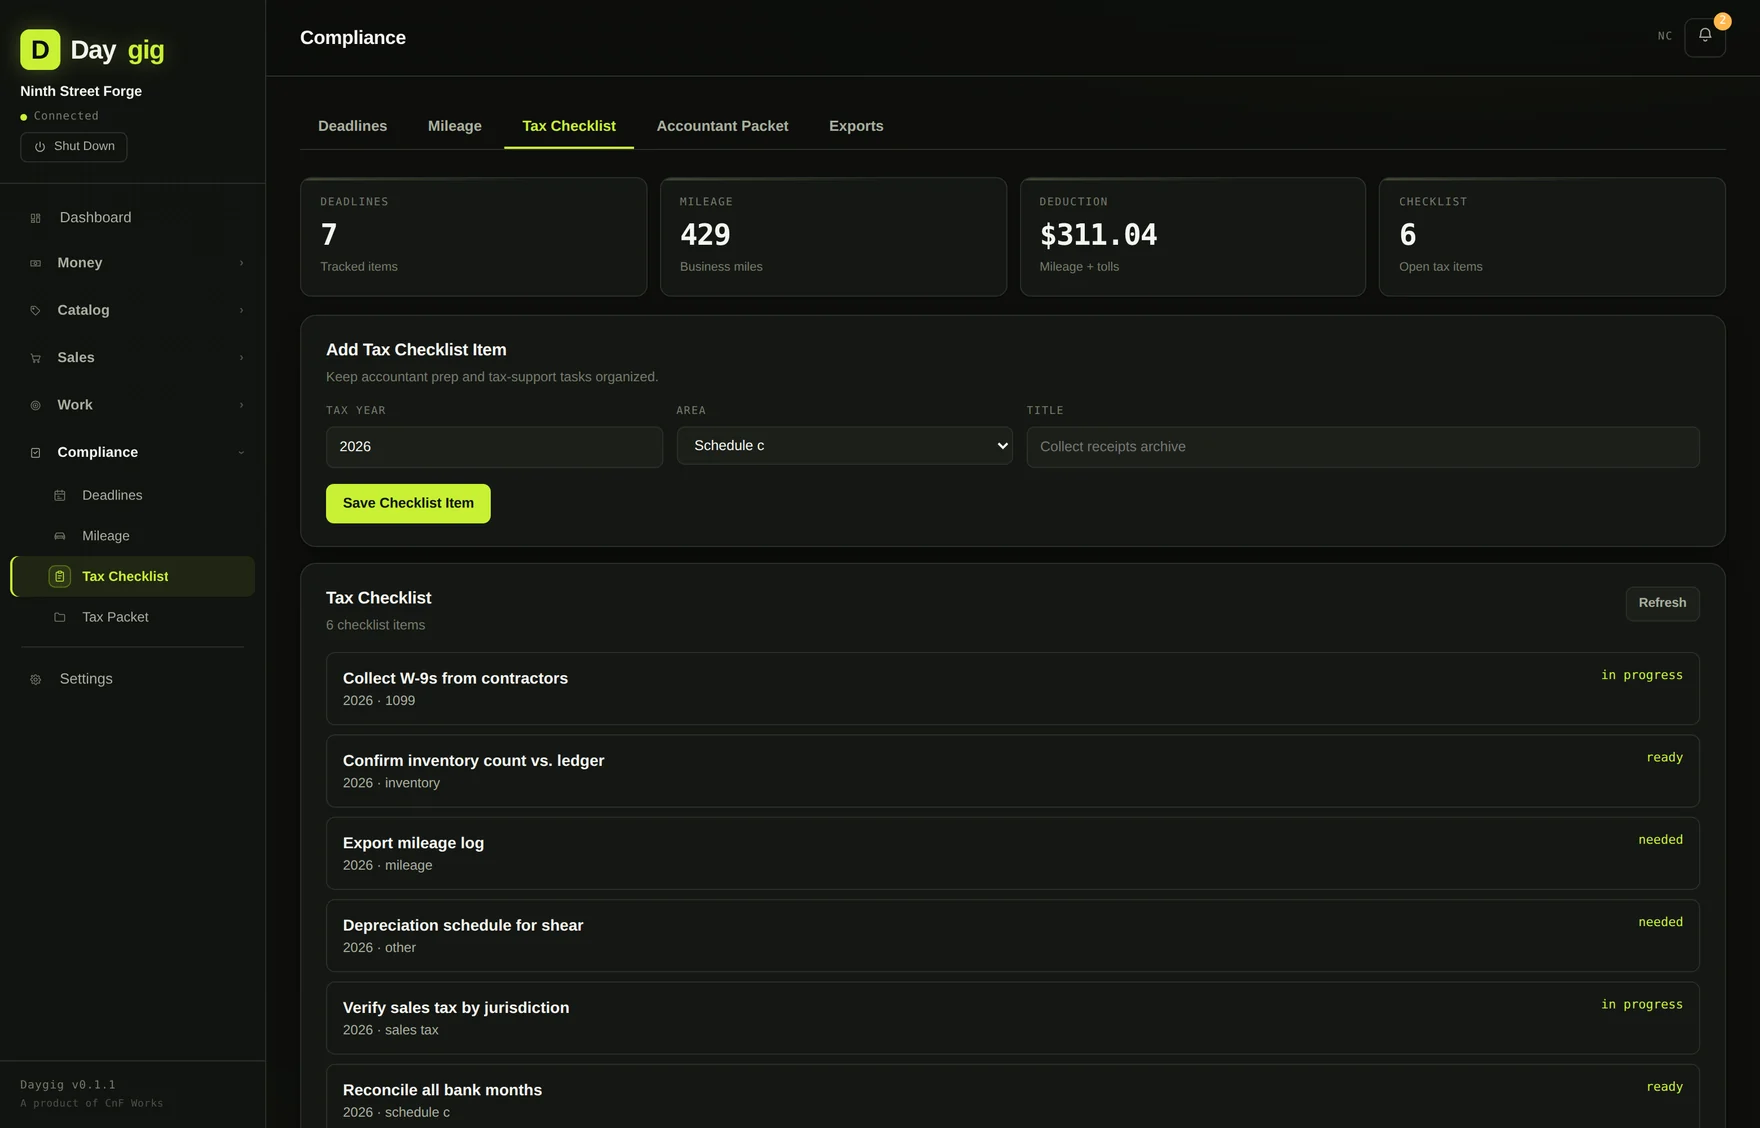
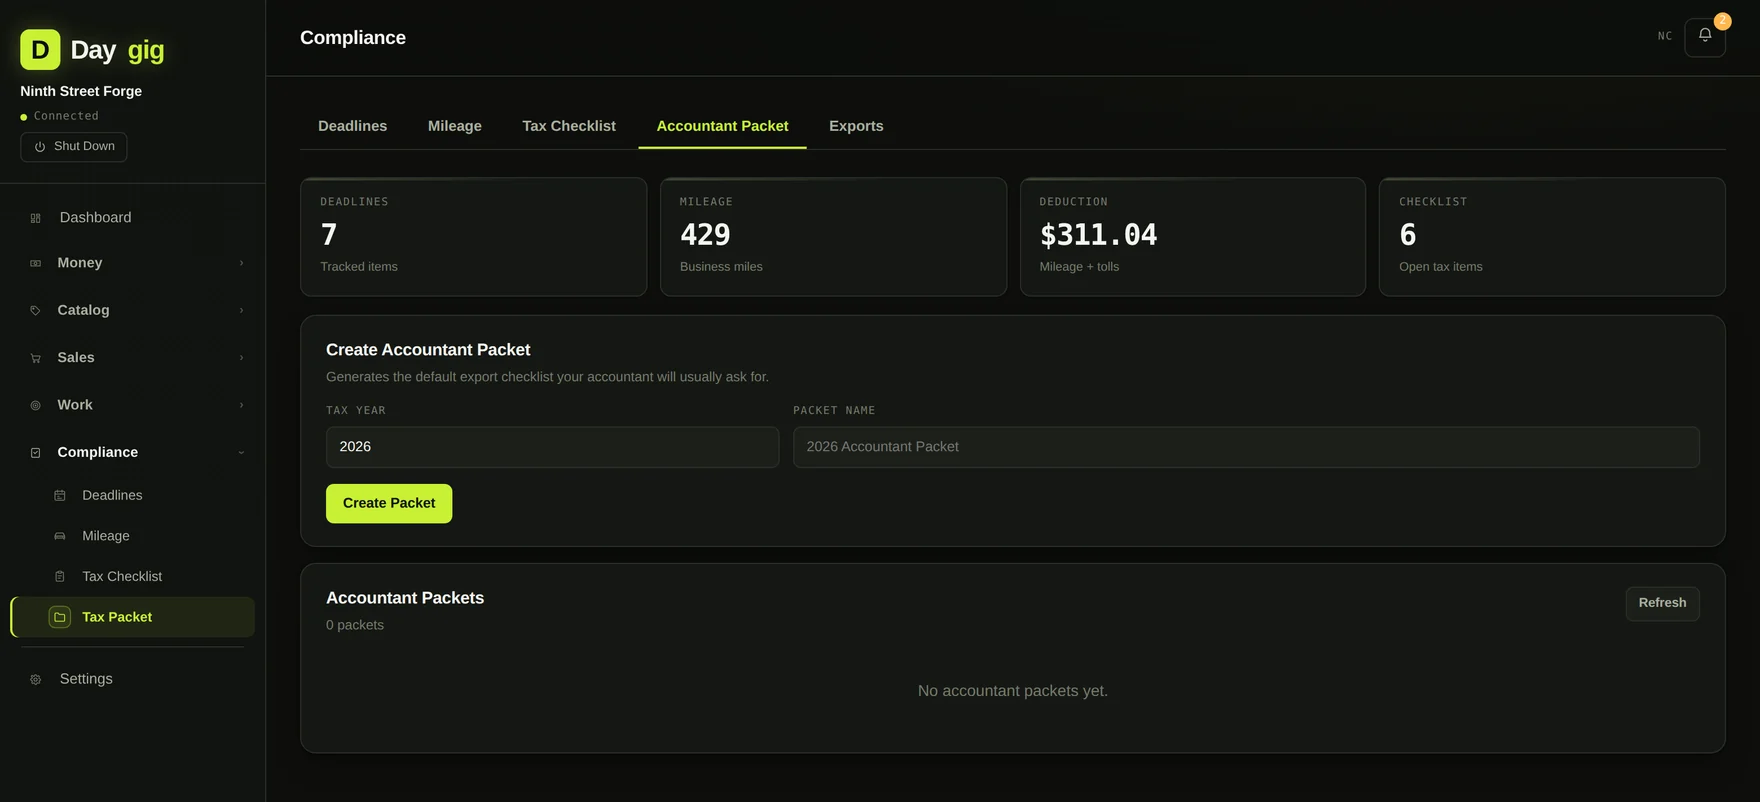
A working checklist of what your accountant is going to ask for, with a status on each item, and a packet builder that assembles the whole set as one export.
13
Settings, backups and your data
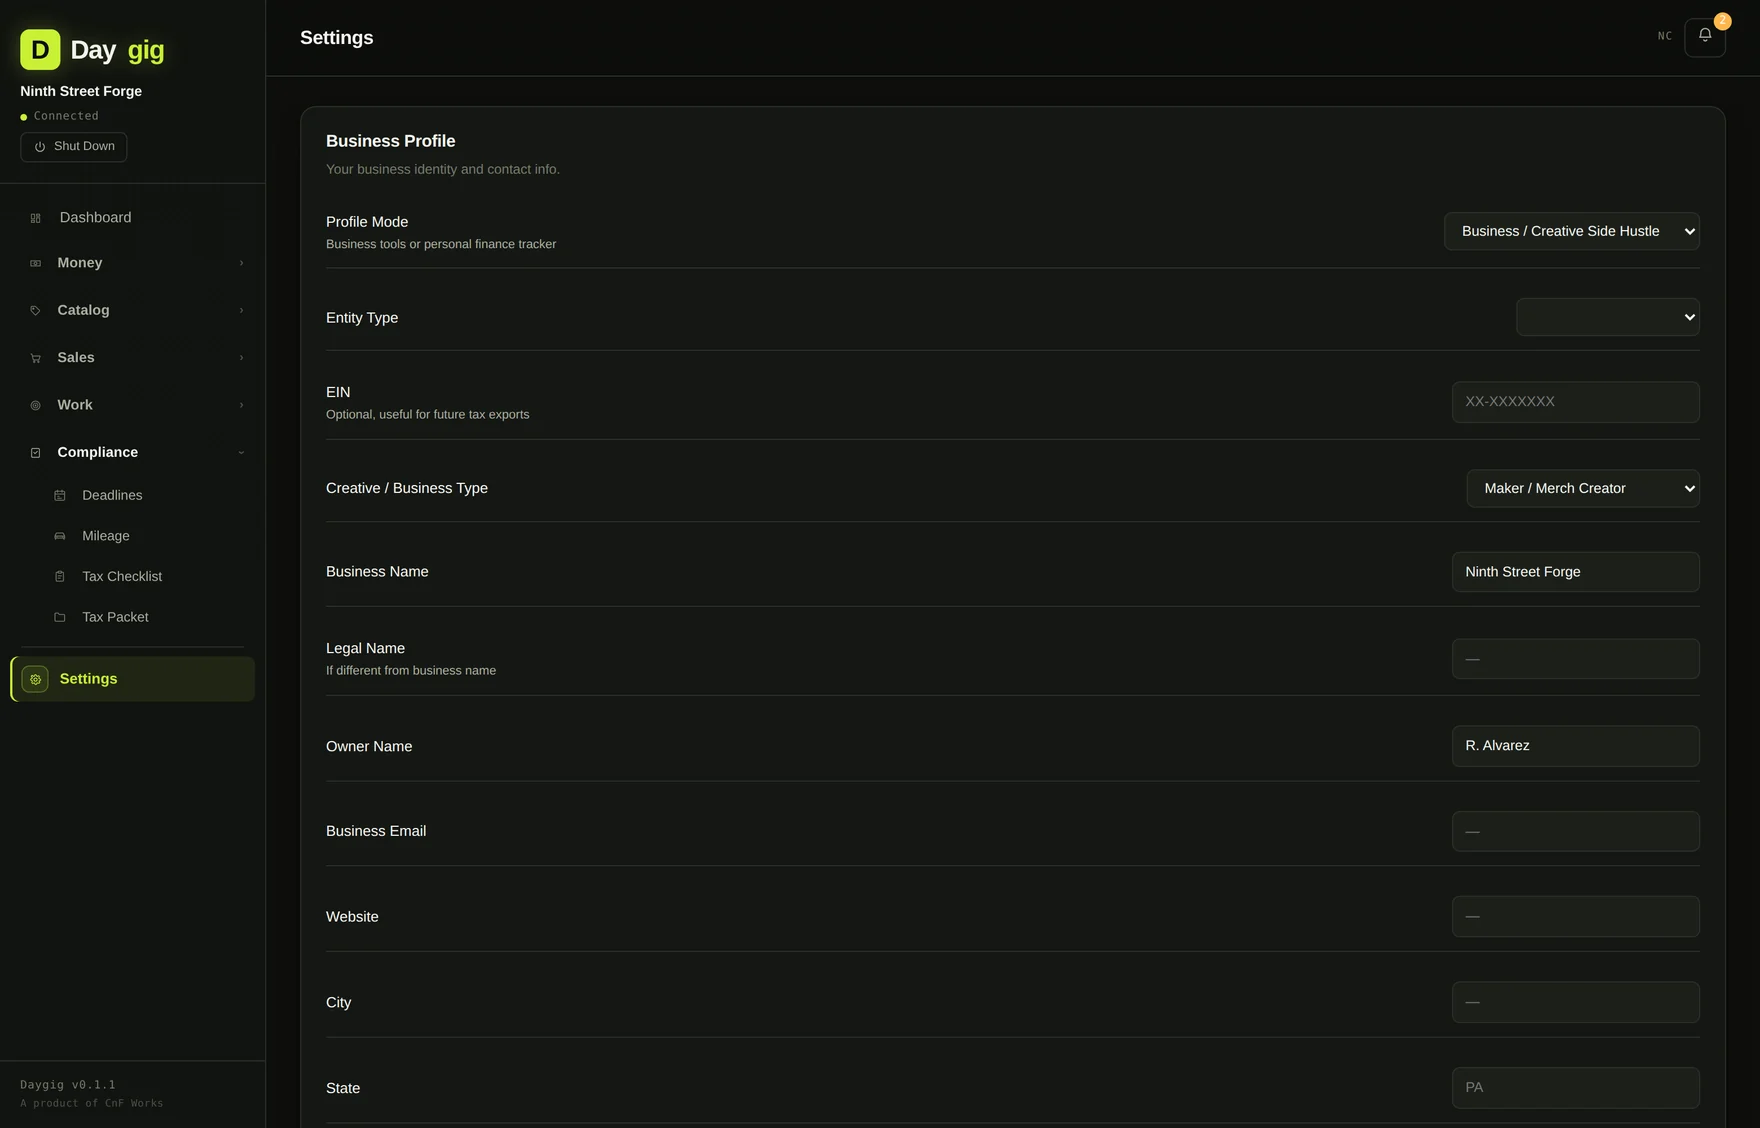
Settings holds your business details, tax rates, which modules are switched on, optional integration keys, and the backup panel. From there you can take a manual snapshot, restore one, set how many automatic snapshots to keep, or export everything.
Daygig takes a full snapshot of your database before nearly every write, using SQLite's online backup API so the copy is consistent rather than a file grab that could miss a recent transaction. The most recent hundred are kept by default.
For how any of this works underneath, the how-it-works page covers the architecture, the security model, the storage format, and what Daygig deliberately doesn't do.